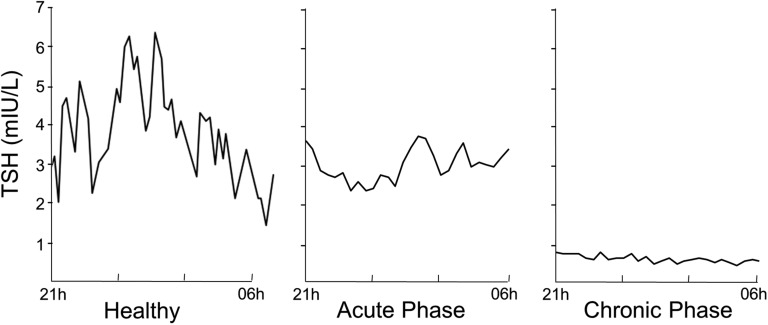
Figure 2.
Illustration of the biphasic response of TSH to critical illness. Representative nocturnal TSH serum concentration profiles of a healthy volunteer and of two critically ill patients are shown to illustrate the differences between the acute and chronic phases of critical illness. [Adapted with permission from Van den Berghe G, de Zegher F, Bouillon R: Clinical review 95: Acute and prolonged critical illness as different neuroendocrine paradigms. J Clin Endocrinol Metab. 1998;83(6):1827-1834.]

