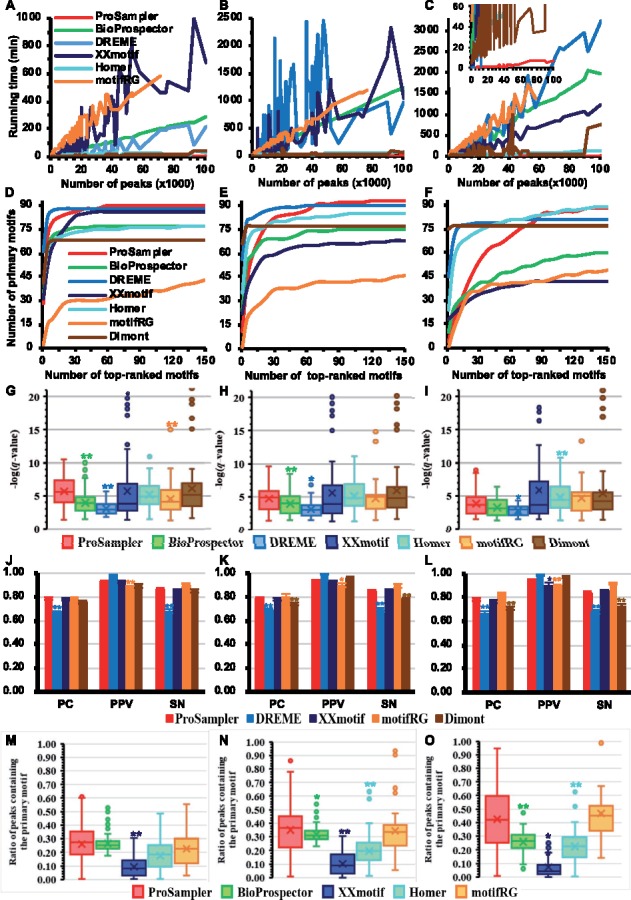
Fig. 2.

Performance comparison of the six programs for speed and identifying the primary motifs in real ChIP-seq datasets. (A, B and C). Running time of the programs as a function of the size of the datasets in G1, G2 and G3, respectively. The inset in (C) is a blow-up view with the running time below 60 min. (D, E and F) Cumulative number of primary motifs recovered by top-ranked motifs in the datasets in G1, G2 and G3, respectively. (G, H and I) Box plot of the q-values of predicted motifs of the programs, matching the primary motifs in the datasets in G1, G2 and G3, respectively. (J, K and L) Performance of the programs for predicting the lengths of primary motifs in the datasets in G1, G2 and G3, respectively. (M, N and O) Proportion of sequences found by the programs to contain the binding sites of primary motifs in the datasets in G1, G2 and G3, respectively. Labels * and ** have the same meanings as in Figure 1
