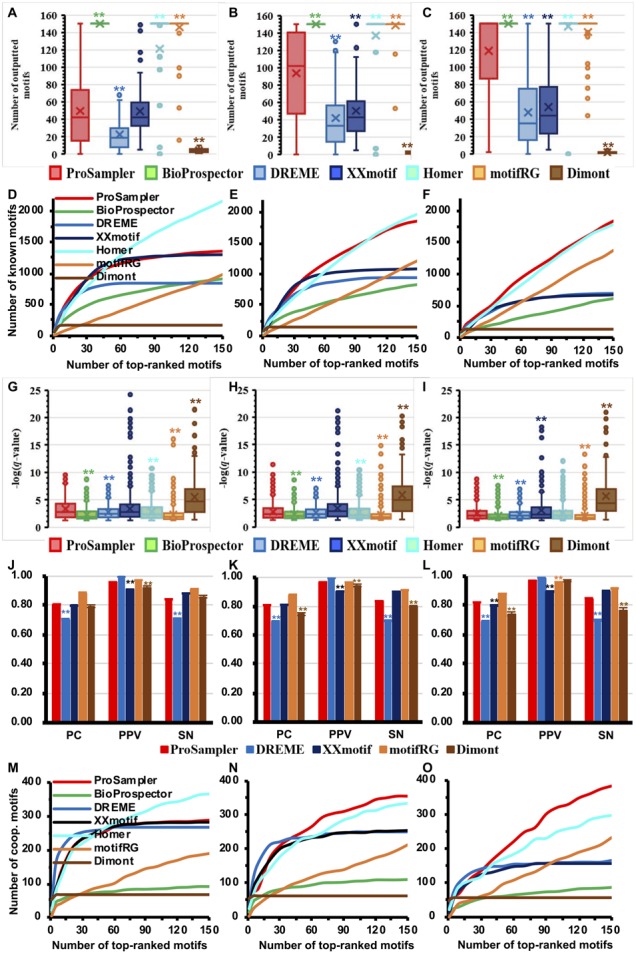
Fig. 3.

Performance comparison of the programs for identifying cooperative motifs in real ChIP-seq datasets. (A, B and C) Number of motifs returned by the programs in the G1, G2 and G3 datasets, respectively. (D, E and F) Cumulative number of known motifs matched by top ranked motifs of the programs in the G1, G2 and G3 datasets, respectively. (G, H, I) Box plot of the q-values of motifs predicted by the programs matching known motifs in the G1, G2 and G3 datasets, respectively. (J, K and L) Performance of the programs for predicting the lengths of known motifs in the G1, G2 and G3 datasets, respectively. (M, N and O) Cumulative number of the target TFs’ known cooperative motifs matched by top ranked motifs of the programs in the G1, G2 and G3 datasets, respectively. Labels * and ** have the same meanings as in Figure 1
