
Fig. 4.
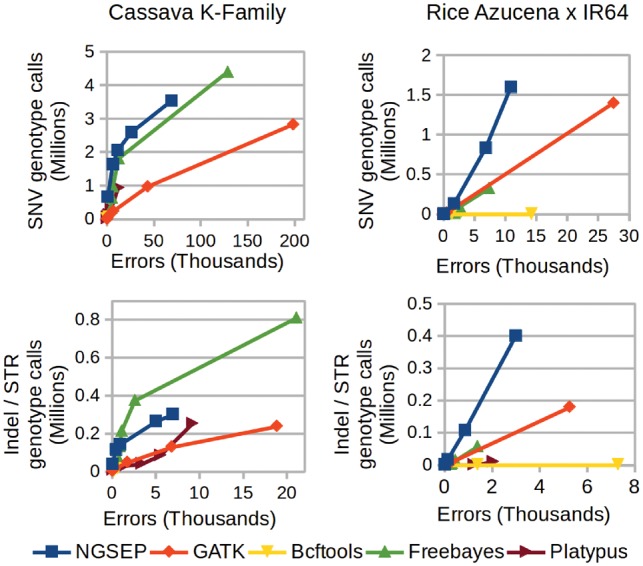
Comparison of different tools for population variants discovery and genotyping using reads taken from real GBS experiments on two different biparental populations of cassava (left panels) and rice (right panels). In absence of a gold standard, the total number of genotype calls is used as a measure of sensitivity and the number of errors inferred from the population structure is used as a measure of specificity. Curves are obtained varying the filter of minimum genotype quality (GQ field in the VCF file) according to the observed distribution of GQ values for each tool