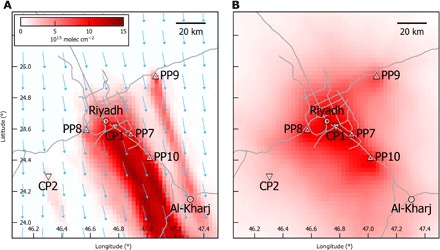
Fig. 1. Tropospheric NO2 column over Riyadh as derived from TROPOMI.

(A) Single overpass on 17 December 2017. Arrows indicate ECMWF wind vectors at 450 m above ground. Gray lines show motorways and trunk roads (20). Symbols mark city centers (o), PPs (Δ), and CPs (∇). See table S1 for plant locations and references. (B) Temporal average for December 2017 to October 2018.
