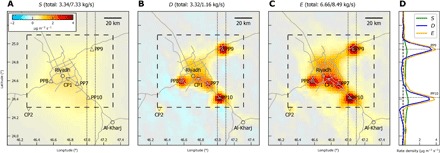
Fig. 2. NOx budget over Riyadh for December 2017 to October 2018.

(A) sinks S, (B) divergence D, and (C) top-down NOx emissions E = S + D. Numbers on top give spatial integrals for urban area (dashed rectangle) and greater area (250 × 250 km2). (D) Meridional sections of S, D, and E at 47.05°E (dotted rectangle), crossing PP9 and PP10.
