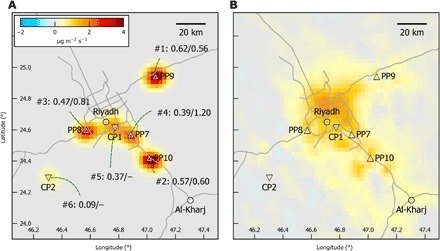
Fig. 3. Separation of top-down emissions in point sources and residual city emissions.

(A) Detected point source peaks Eps, identified as PP7 to P10 and CP1 and CP2. For each point source, a label provides i) the rank within the iterative peak fitting, ii) the total emission rate (in kg/s), and iii) the emission intensity (in g/kWh) resulting from division by PP capacity (table S1). (B) Residual city emissions E − Eps.
