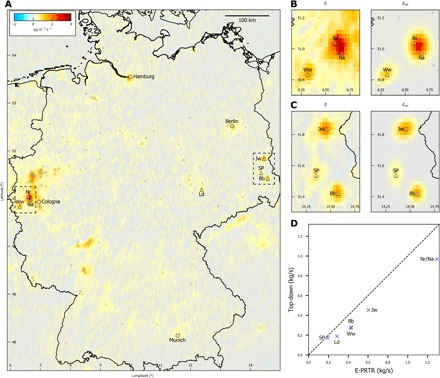
Fig. 5. NOx emissions for Germany.

(A) Top-down emissions E averaged for April to October 2018. Large cities (>106 inhabitants) and the lignite-fired PPs (>1 GW) are labeled. Smaller cities (>2 × 10⁵ inhabitants) and the 100 largest point sources in Germany, as listed in E-PRTR, are shown by gray symbols (Δ, PP; ∇, CP; and □, other). Dashed rectangles indicate zoom regions. (B and C) Zooms of top-down emissions (left) and corresponding fitted point sources (right) for western and eastern PPs, respectively. (D) Correlation of fitted point source emissions to bottom-up values from E-PRTR for lignite PPs. See table S3 for details. Nr, Neurath; Na, Niederaußem; Jw, Jänschwalde; Bb, Boxberg; Ww, Weisweiler; Ld, Lippendorf; SP, Schwarze Pumpe.
