
Fig. 3. EGFR signaling regulates arousal threshold and sleep homeostasis.
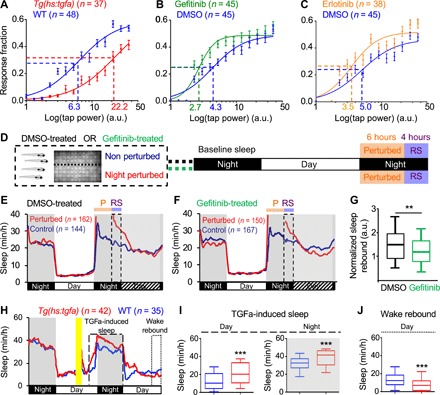
Representative stimulus response curves for Tg(hs:tgfa) animals and their WT siblings following HS (A), gefitinib and DMSO vehicle-treated WT siblings (B) and erlotinib and DMSO vehicle-treated WT siblings (C). Data points indicate mean ± SEM fraction of animals that responded to the stimulus. Dashed lines mark ETP50 values. (A) Tg(hs:tgfa) animals had an ETP50 value of 22.2 versus 6.3 for WT siblings (252% increase; F1,834 = 20.95, P < 0.0001 by extra sum-of-squares F test). (B) Gefitinib-treated animals had an ETP50 of 2.7 versus 4.3 for DMSO-treated siblings (37% decrease; F1,834 = 18.16, P < 0.0001 by extra sum-of-squares F test). (C) Erlotinib-treated animals had an ETP50 of 3.5 versus 5.0 for DMSO-treated siblings (30% decrease; F1,834 = 4.9, P < 0.05 by extra sum-of-squares F test). a.u., arbitrary units. n = number of animals. (D) SD paradigm. (E and F) Sleep behavioral traces for animals treated with DMSO (E) or gefitinib (F) starting at 5 dpf, subjected to SD during the first 6 hours of the night at 7 dpf (P; orange), and monitored thereafter in the dark. The 4-hour periods of RS (purple) are indicated with dashed boxes. (G) Normalized sleep rebound in DMSO- or gefitinib-treated siblings following SD. Normalized sleep rebound = amount of sleep for each perturbed animal during the first 4 hours of RS divided by the average amount of sleep of all nonperturbed controls during this time period. (H to J) After a 1-hour HS in the middle of the day (yellow bar), Tg(hs:tgfa) animals showed increased daytime and nighttime sleep for ~24 hours (H and I), followed by decreased sleep (H and J). Sleep in (I) and (J) is quantified for the boxed regions in (H), which includes the entire night and the last 3 hours of each day. Pooled data from five (D to G) and two (H to J) experiments are shown. Black, white, and hatched bars under behavioral traces indicate night (10 hours), day (14 hours), and subjective day (14 hours), respectively. n = number of animals. **P < 0.01 and ***P < 0.001 by Mann-Whitney test.