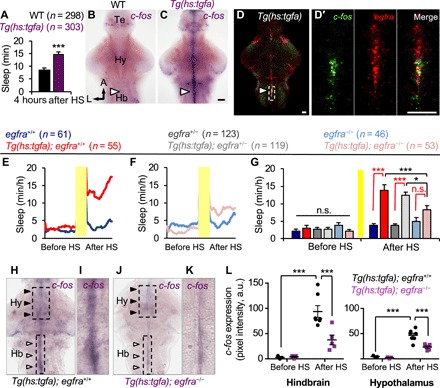
Fig. 4. TGFa overexpression–induced sleep requires EGFRa.

(A) Total sleep induced following TGFa overexpression quantified during the fourth hour after HS. (B and C) c-fos expression in a Tg(hs:tgfa) brain at 4 hours after HS shows activation of juxtaventricular cells in the telencephalon, hypothalamus, and hindbrain (arrowhead) (C), but not in the brain of an identically treated WT sibling (B). (D and D′) Double FISH of a Tg(hs:tgfa) brain fixed at 4 hours after HS shows coexpression of egfra and c-fos in juxtaventricular cells. Boxed region in (D) is magnified in (D′). Images are 2.9-μm-thick (D) and 0.7-μm-thick (D′) confocal sections. (E to G) TGFa overexpression increased sleep in transgenic animals compared to nontransgenic siblings in egfra+/+, but not in egfra−/− animals (red comparisons) (G). TGFa overexpression–induced sleep was significantly decreased in egfra−/− animals compared to egfra+/− and egfra+/+ (black comparisons) (G). Yellow bars indicate HS. Pre- and post-HS data are calculated for the day of HS. Data are obtained from six pooled experiments. Bar graphs show mean ± SEM. n.s., not significant. (H to L) Juxtaventricular c-fos expression that is induced by TGFa overexpression (white arrowheads) is suppressed in egfra−/− animals (J and K) compared to egfra+/+ animals (H and I) at 4 hours after HS. Hindbrain (Hb)–boxed regions in (H) and (J) are magnified in (I) and (K). (L) Quantification of c-fos expression in hindbrain and hypothalamus egfra-expressing cells [boxed regions in (H) and (J)]. Data points represent single brains. n = number of animals. *P < 0.05 and ***P < 0.005 by two-way ANOVA with Holm-Sidak test. Te, telencephalon; Hb, hindbrain. Scale bars, 30 μm.
