
Fig. 5. EGFR signaling promotes sleep via NPVF.
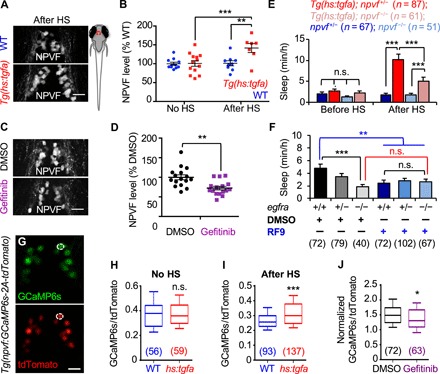
(A to D) Larval zebrafish schematic. Red box indicates hypothalamic region shown in (A), (C), and (G). Immunostaining with an NPVF-specific antibody reveals higher NPVF protein levels at 2 hours after HS for Tg(hs:tgfa) animals compared to WT siblings (A and B) and lower NPVF protein levels in animals fixed at 3 hours after treatment with gefitinib compared to DMSO-treated controls (C and D). Representative images are shown in (A) and (C), and average pixel intensity of NPVF labeling is quantified in (B) and (D); each dot represents one animal. (E) TGFa-induced sleep was partially suppressed in npvf−/− animals compared to npvf+/− siblings. Animals were heat-shocked at 3 p.m. Pre- and post-HS quantify sleep for the day of HS. (F) egfra−/− animals slept less than their egfra+/+ siblings (black comparison), and RF9 suppressed sleep in egfra+/+ animals compared to DMSO-treated egfra+/+ siblings (blue comparison), but RF9 treatment did not further decrease sleep in egfra−/− animals compared to DMSO-treated egfra−/− siblings (red comparison). RF9 was added on the afternoon of 5 dpf, and sleep was quantified during the day at 6 and 7 dpf. (G) Representative images from a Tg(npvf:GCaMP6s-p2A-tdTomato) animal. An individual NPVF neuron is indicated with a white circle. (H) No difference in GCaMP6s/tdTomato values was observed between non–heat-shocked Tg(hs:tgfa) and WT siblings. (I) GCaMP6s/tdTomato values were significantly increased in Tg(hs:tgfa) animals compared to WT siblings at 2 hours after HS. (J) Normalized GCaMP6s/tdTomato values were significantly decreased in WT gefitinib-treated animals compared to DMSO-treated siblings. Normalized GCaMP6s/tdTomato = GCaMP6s/tdTomato value in each neuron at 2 hours after the addition of either gefitinib or DMSO divided by the value in the same neuron before treatment is shown. Bar graphs (E and F) and lines (B and D) indicate mean ± SEM. Numbers in parentheses indicate number of animals (E and F) or neurons (H to J). *P < 0.05, **P < 0.01, and ***P < 0.001 by two-way ANOVA with Holm-Sidak test (E and F) or by two-tailed Wilcoxon matched-pairs signed-rank test (H to J). Scale bars, 20 μm.