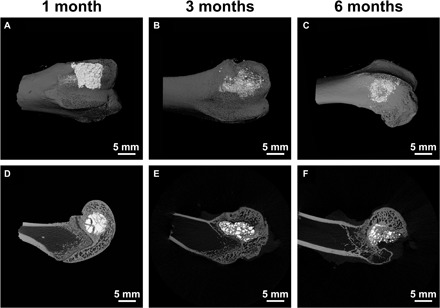
Fig. 2. Micro-CT images of HA-Tb powder in bone tissue.

After implantation for 1, 3, and 6 months, the overall distribution and degradation change of the implanted HA-Tb material and bone remodeling at the macro level. (A to C) Reconstructed images. (D to F) Scanned single-layer images.
