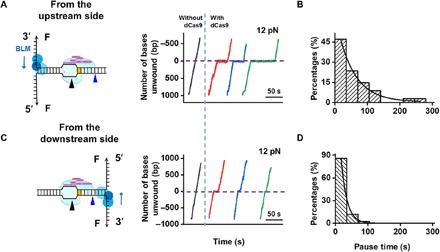
Fig. 4. BLM unwinds through DNA-bound dCas9.

(A and C) The BLM unwinding was initiated from either the upstream (A) or downstream (C) side of the PAM. Representative traces showed the number of unwound base pairs versus time under an assisting force of 12 pN in the presence or absence of prebound dCas9. For clarity, the traces have been shifted along the time axis. The dashed lines indicate the expected dCas9 binding position. (B and D) Histogram showing the pause time of BLM at the expected dCas9 binding position when unwinding started on the upstream (B) or downstream (D) side of the PAM. These time distributions followed a single exponential distribution with average times of 51 and 17 s, respectively.
