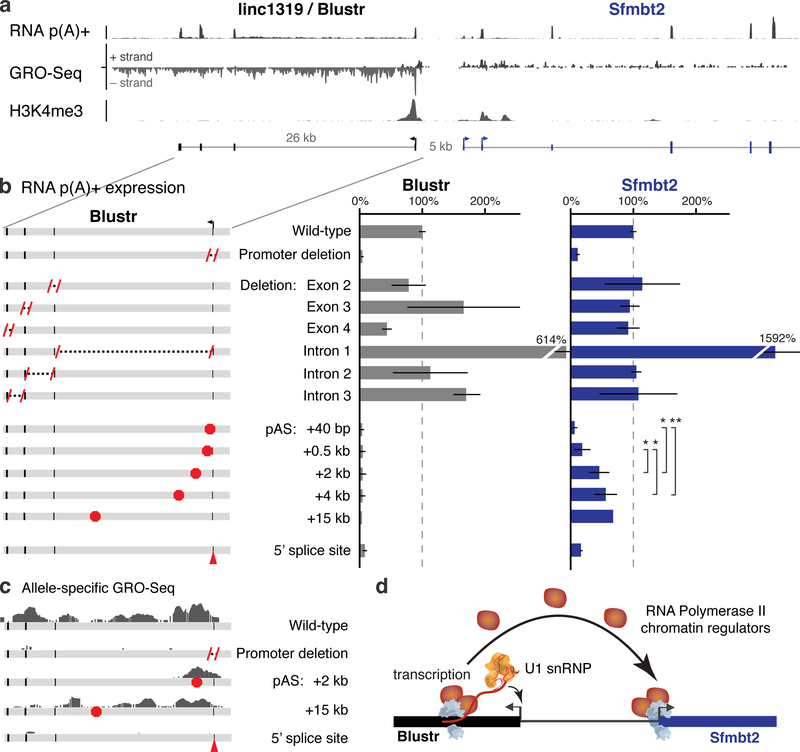
Fig. 3. Transcription and splicing of Blustr activates Sfmbt2 expression.
(a) p(A)+ RNA-seq, GRO-seq, and H3K4me3 ChIP-Seq in the Blustr locus. Sfmbt2 has two alternative TSSs. (b) p(A)+ RNA expression on knocked-out alleles compared to controls (arrows). Error bars: 95% CI for the mean (n ≥ 2 alleles, except for pAS +15 kb where n = 1, see Table S1). Sfmbt2 pAS comparisons: two-sided t-test P < 0.05 (*) or < 0.01 (**). (c) Allele-specific GRO-seq signal for clones carrying indicated modifications. Only reads mapping to the modified allele are shown (Cast for pAS +2 kb; 129 for others). (d) Model for how transcription in the Blustr locus activates Sfmbt2.

