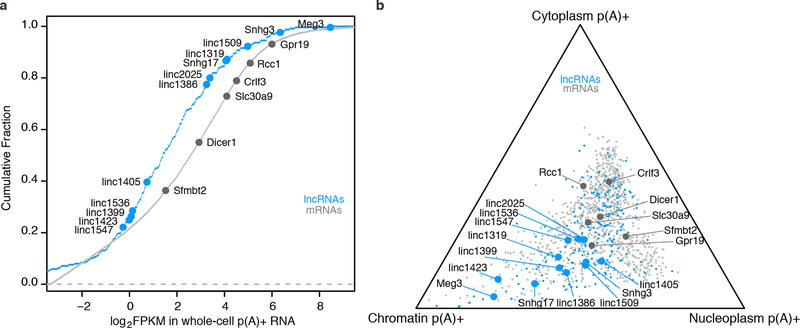
Extended Data Fig. 1. Expression and subcellular localization of knocked-out lncRNAs and mRNAs.
(a) Expression of lncRNAs and mRNAs in F1 129/Castaneus female mESCs, reported in fragments per kilobase per million (FPKM) in whole-cell p(A)+ RNA-seq. Cumulative fraction is plotted for all mRNAs expressed in mESCs. Large dots represent transcripts whose promoters we deleted in this study. LncRNAs and mRNAs span a >20-fold range of abundance levels. (b) Relative subcellular localization of lncRNAs and mRNAs. We sequenced p(A)+ RNA from chromatin, soluble nuclear, and cytoplasmic fractions (see Methods) and plotted the relative abundance of mature transcripts in each fraction. We selected lncRNAs that showed localization biased toward the nuclear fractions relative to most mRNAs. For comparison, we plotted 1,000 randomly selected mRNAs (light gray).

