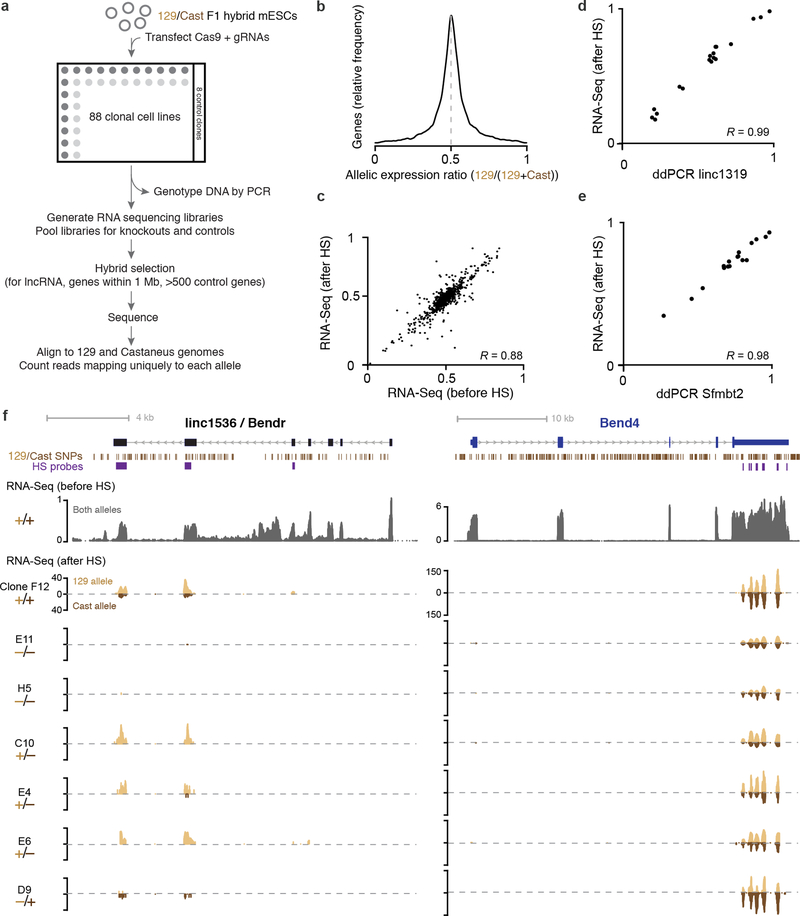
Extended Data Fig. 2. Generation of knockout clones and measurement of allele-specific RNA expression.
(a) Overview of knockout and measurement protocol. (b) Distribution of allelic expression ratios (number of informative reads mapping to 129S1 allele divided by the number mapping to either the 129S1 or the Castaneus allele) across active genes in mESCs. (c) Scatterplot of allelic expression ratios for genes with RPKM ≥ 2 that have more than 100 allele-informative reads across all libraries. Allelic expression ratios are consistent in RNA sequencing data before and after hybrid selection (HS). (d) Allelic expression ratios as measured by two independent methods for Blustr and (e) Sfmbt2 expression in 15 clonal cell lines containing genetic modifications in the Blustr locus. (f) Example locus showing hybrid selection strategy and RNA-seq coverage for cell lines with the indicated genotype for deletion of the Bendr promoter. Y-axis scales represent normalized read counts and are the same for all hybrid selection tracks. The absolute level of expression for any given gene varies among clonal cell lines; throughout this work, we instead consider the relative level of expression between the two alleles in heterozygous knockout cells. For similar plots of each gene studied, see http://pubs.broadinstitute.org/neighboring-genes/.

