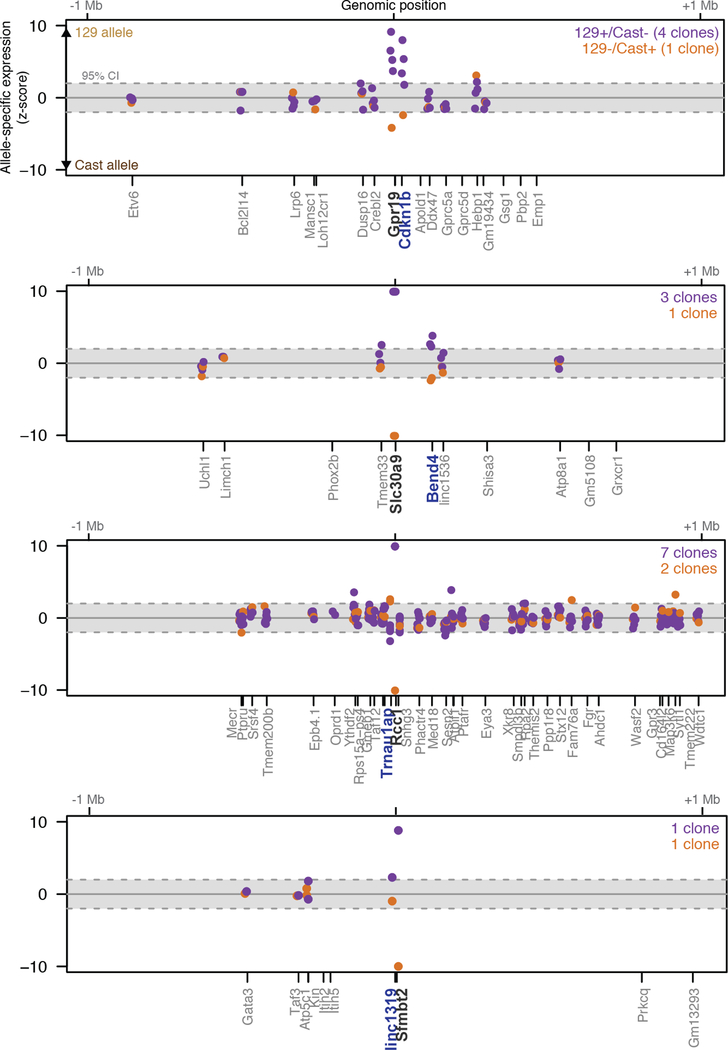
Extended Data Fig. 5. Promoter knockouts for 4 mRNAs affect the expression of a neighboring gene.
Significance (z-score) of allele-specific expression ratios at all genes within 1 Mb of each of 4 mRNA loci. Each dot represents a different heterozygous promoter knockout clone for a given gene. Dots are shown only for genes that are sufficiently highly expressed to assess allele-specific expression (see Methods). The y-axis is capped at –10 to +10 standard deviations from the mean. Black: knocked-out lncRNA. Blue: Gene with significant allele-specific change in gene expression (FDR < 10%). Independent clones are not expected to yield the same significance value (z-score), in part because read depth differs between samples.

