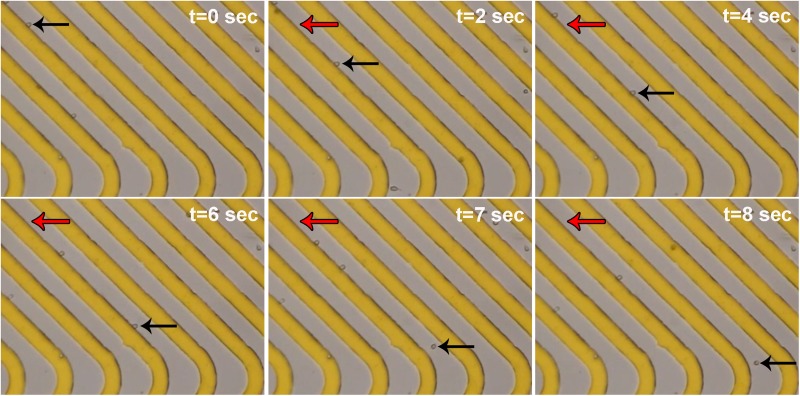
FIG. 4.
Movement of cells along electrodes in the DEP module. A time series of phase contrast images (10×) show cells moving along the slanted electrodes (gold) in the DEP module when electrodes were actuated at 150 kHz, 6 Vpp. One cell's position at each time point is shown by black arrows, while red arrows mark the starting position of that cell in the first panel. The last two panels (t = 7 s and t = 8 s) show the cell releasing from the electrode at the rounded tip and moving further down the channel.

