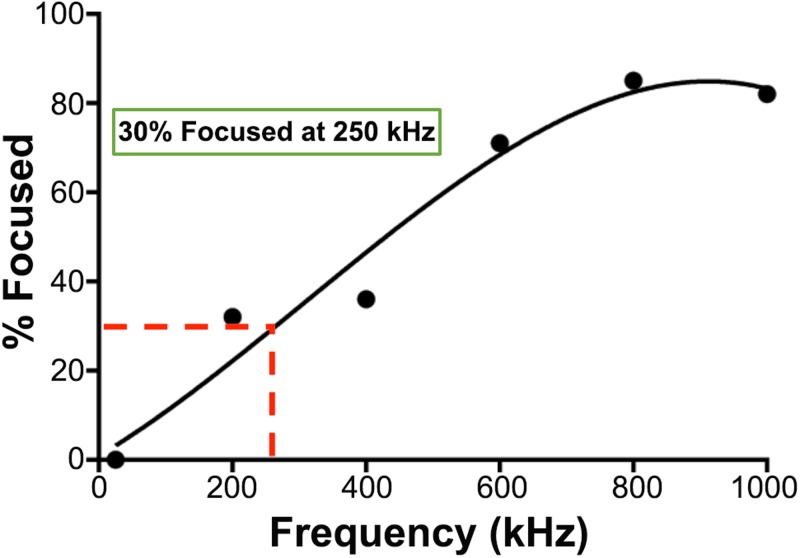
FIG. 6.
Representative focusing curve. A focusing curve from a mouse NSPC sorting experiment shows the gradual increase in the percentage of cells focused to the inner channel across increasing frequency. A best fit line was used to determine 250 kHz as the appropriate sorting frequency for this population.

