
Figure 4.
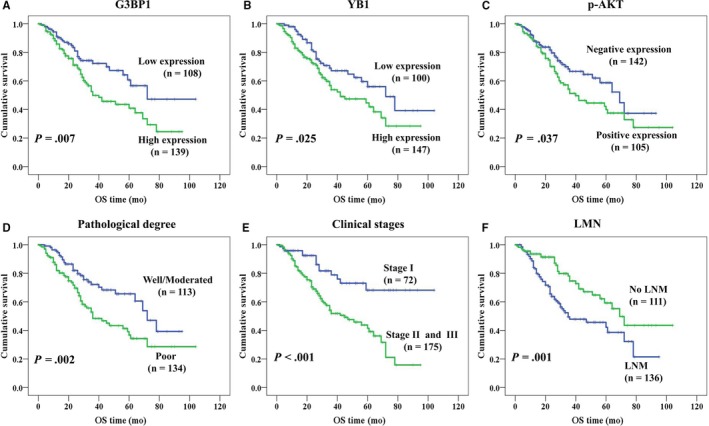
Kaplan‐Meier curves for overall survival of NSCLC patients assessed using the log‐rank test (all tests were two‐sided). Patients with high expression of G3BP1 (A, P = .007) and YB1 (B, P = .025) had longer survival time. Low expression of p‐AKT was significantly related to better prognosis (C, P = .037), as well as well/moderated differentiation (D, P = .002), stage I (E, P < .001) and without LNM (F, P = .001)