
Figure 6.
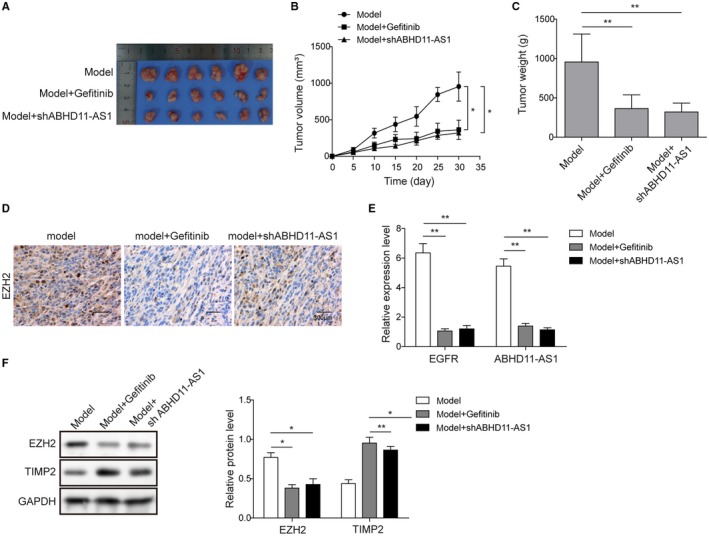
EGFR regulated‐ABHD11‐AS1 in the progression of ovarian cancer progress in vivo. A, Comparison of tumor sizes between groups treated with Gefitinib, with shABHD11‐AS1, and no treatment. B, Tumor growth curve for groups treated with Gefitinib, with shABHD11‐AS1, and no treatment. C, Tumor weight for groups treated with Gefitinib, with shABHD11‐AS1, and no treatment. D, Immunohistochemistry was used to detect expression of EZH2 in groups treated with Gefitinib, with shABHD11‐AS1, and no treatment. Scale bar, 300 μm. E, qRT‐PCR was used to examine the expression of ABHD11‐AS1 and EZH2 in groups treated with Gefitinib, with shABHD11‐AS1, and no treatment. F, Western blot was used to detect the expression of EZH2 and TIMP2 in groups treated with Gefitinib, with shABHD11‐AS1, and no treatment. GAPDH was served as loading control. *P < .05, **P < .01