. 2019 Sep 27;8(16):6887–6893. doi: 10.1002/cam4.2574
© 2019 The Authors. Cancer Medicine published by John Wiley & Sons Ltd.
This is an open access article under the terms of the http://creativecommons.org/licenses/by/4.0/ License, which permits use, distribution and reproduction in any medium, provided the original work is properly cited.
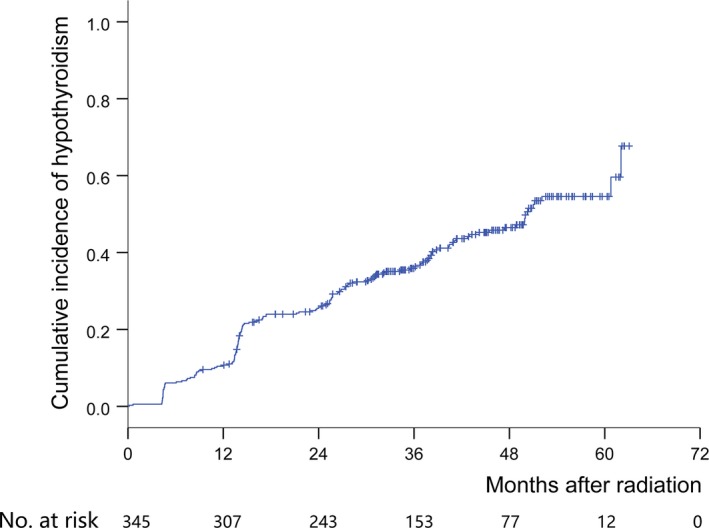
Figure 1.

Kaplan‐Meier curve for hypothyroidism
