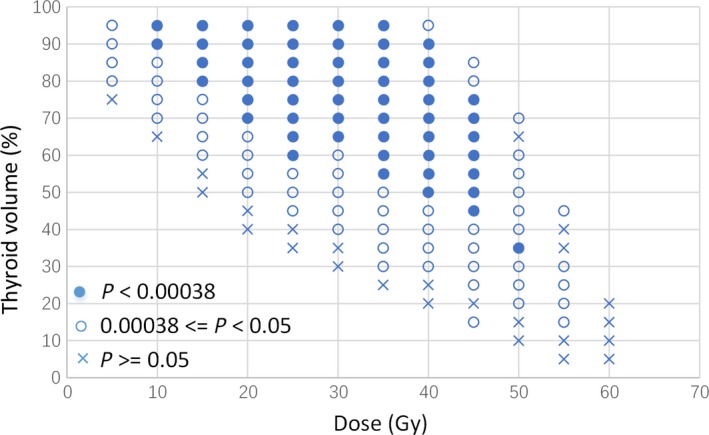
Figure 2.

Results of univariate analysis of the association between different thyroid dose‐volume histogram parameters and hypothyroidism. An “x” represents dose‐volume combinations (V Dose > %V vs V Dose ≤ %V) could not discriminate hypothyroidism (P ≥ .05); open circles represent significant comparisons (P < .05); closed circles denote that comparisons remained significant under a stricter criterion of P < .00 038 (=0.05/133), which was required by the Bonferroni adjustment
