Figure 3.

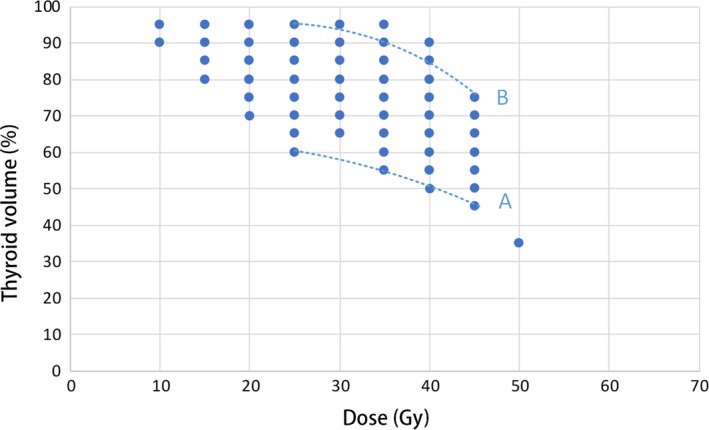
Dose‐volume histogram (DVH) constraints. Curve A: stringent thyroid DVH constraints, with V 25Gy ≤ 60%, V 35Gy ≤ 55%, and V 45Gy ≤ 45%. Curve B: inhibition curve defined by V 25Gy > 95%, V 35Gy > 90%, and V 45Gy > 75%

Dose‐volume histogram (DVH) constraints. Curve A: stringent thyroid DVH constraints, with V 25Gy ≤ 60%, V 35Gy ≤ 55%, and V 45Gy ≤ 45%. Curve B: inhibition curve defined by V 25Gy > 95%, V 35Gy > 90%, and V 45Gy > 75%