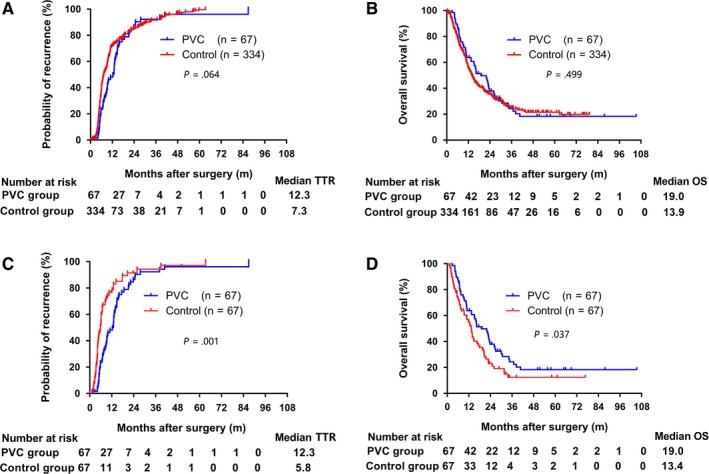
Figure 3.

Kaplan‐Meier estimates for time to recurrence (TTR) and overall survival (OS) according to treatment type. Cumulative recurrence rate (A) and overall survival rate (B) in patients with HCC and PVTT in PVC group and control group before propensity score matching. Cumulative recurrence rate (C) and overall survival (D) in patients with HCC and PVTT in PVC group and control group after propensity score matching. Numbers below the x‐axis indicate the number of patients at risk. The log‐rank test was used for comparison
