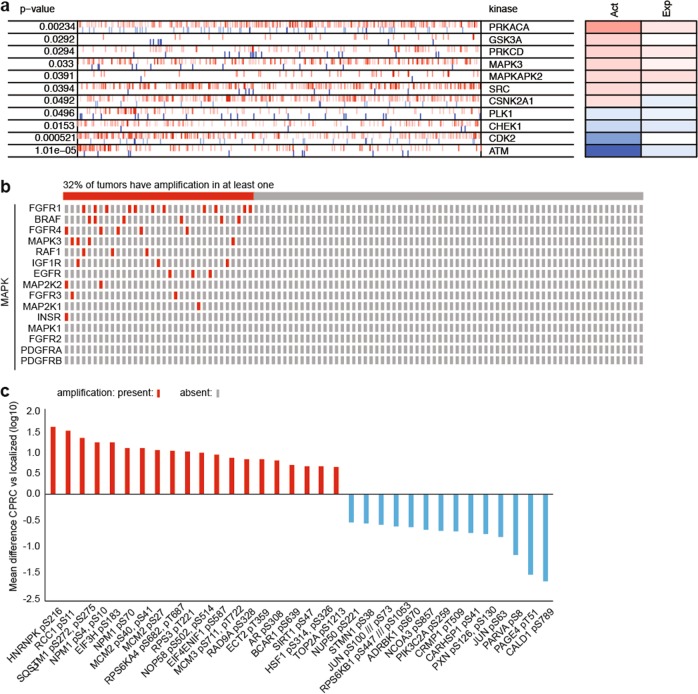
Fig. 1.
a Inferred kinase activation between mCRPC versus localized prostate adenocarcinoma (TCGA) by VIPER. The most activated (red) and repressed (blue) in the mCRPCs compared with localized prostate cancers (TCGA) with p < 0.05. Tick marks represent kinase targets projected onto the gene expression signature. Act: inferred differential activity; Exp: differential expression. MAPK3 = ERK1. b Presence or absence of amplification in selected MAPK pathway related genes in these patients. c ERK1/2 kinase targets differentially phosphorylated between mCRPC and treatment-naive localized prostate tissue. Data was filtered for a false discovery rate cutoff of 0.05, at least a 4-fold difference, and the presence of curated function on phosphosite.org

