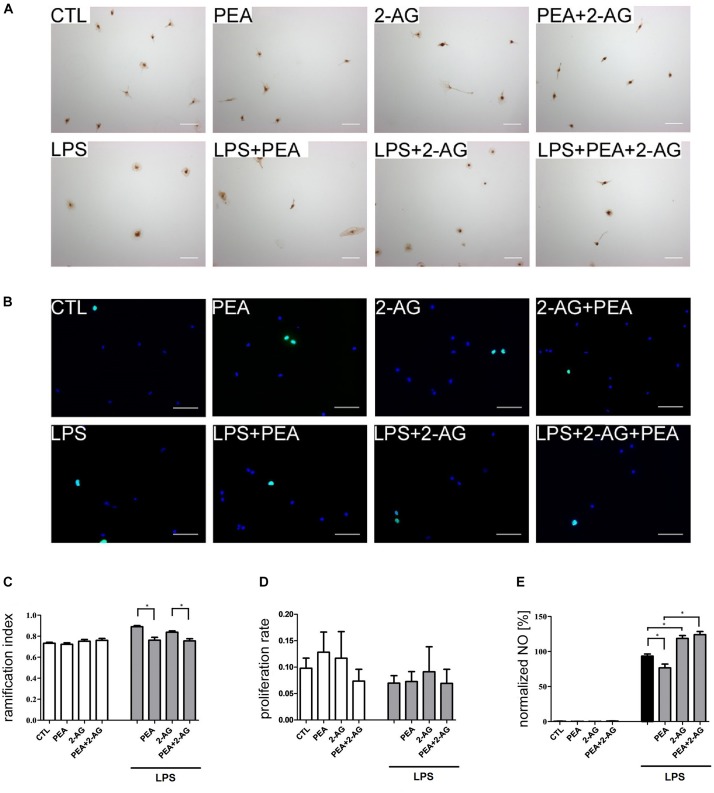
FIGURE 3.
Effect of 2-AG and PEA on ramification index, proliferation index and nitrite concentration of primary rat microglia. Representative pictures of stained microglia for (A) ramification index (IB4) and (B) proliferation rate (BrdU in green, DAPI in blue). Scale bar = 50 μm. (C) Effects of 2-AG and PEA on ramification index. Application of LPS (nLPS = 22) led to an increase in the ramification index in comparison to control group (CTL; nCTL = 22). Whereas PEA co-applied with LPS (nLPS+PEA = 23) reduced the ramification index significantly, 2-AG (nLPS+2–AG = 23) had no effect. 2-AG, PEA, or combination of both applied alone (nPEA = 19, n2–AG = 22, n2–AG+PEA = 22) had no effect on ramification index. The combination of LPS, 2-AG and PEA (nLPS+2–AG+PEA = 22) led to decrease in the ramification index in comparison to the groups treated with LPS and 2-AG. (D) No effect of 2-AG and PEA with/or without LPS on proliferation of primary microglia cells could be observed (nCTL = 12, nLPS = 12, nPEA = 11, n2–AG = 11, n2–AG+PEA = 12, nLPS+PEA = 12, nLPS+2–AG = 11, nLPS+2–AG+PEA = 12). (E) Effects of 2-AG and PEA on nitrite concentration after 72 h. PEA, 2-AG, or PEA combined with 2-AG had no effect on the nitrite concentration in primary microglia (nCTL = 18, nPEA = 18, n2–AG = 18, n2–AG+PEA = 18). After administration of LPS, nitrite concentration increased significantly. PEA co-applied with LPS (nLPS+PEA = 18) decreased the NO production in comparison to LPS (nLPS = 18). 2-AG+LPS (nLPS+2–AG = 18) and also 2-AG+PEA+LPS (nLPS+2–AG+PEA = 18) treated microglia produced significantly more NO in comparison to LPS. Statistics was performed using a one-way ANOVA test with Bonferroni correction and significance was chosen for p < 0.05. The asterisk denotes significant results regarding the respective measurement indicated with the bar. The values are served as a mean with standard error of the mean.

