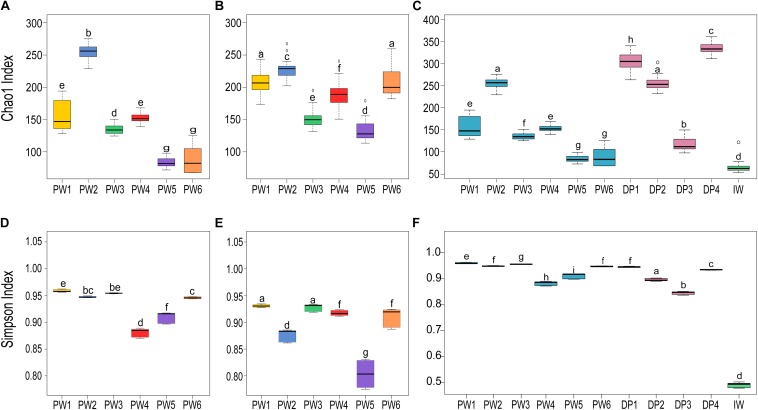
FIGURE 3.
Alpha diversity indices of microbial communities in the different sampling locations. (A,C,D,F) Richness (Chao1) and diversity (Simpson) indices of the total communities. (B,E) Richness and diversity indices of the active communities. Boxes are extended from the 25–75th percentiles, the line in the box is plotted at the median. Whiskers represent the smallest and the largest value. ANOVA followed by Tukey’s multiple comparison tests was used to determine differences among stations. Samples with the same letter indicate that the diversity indices were not significantly different (p > 0.05).

