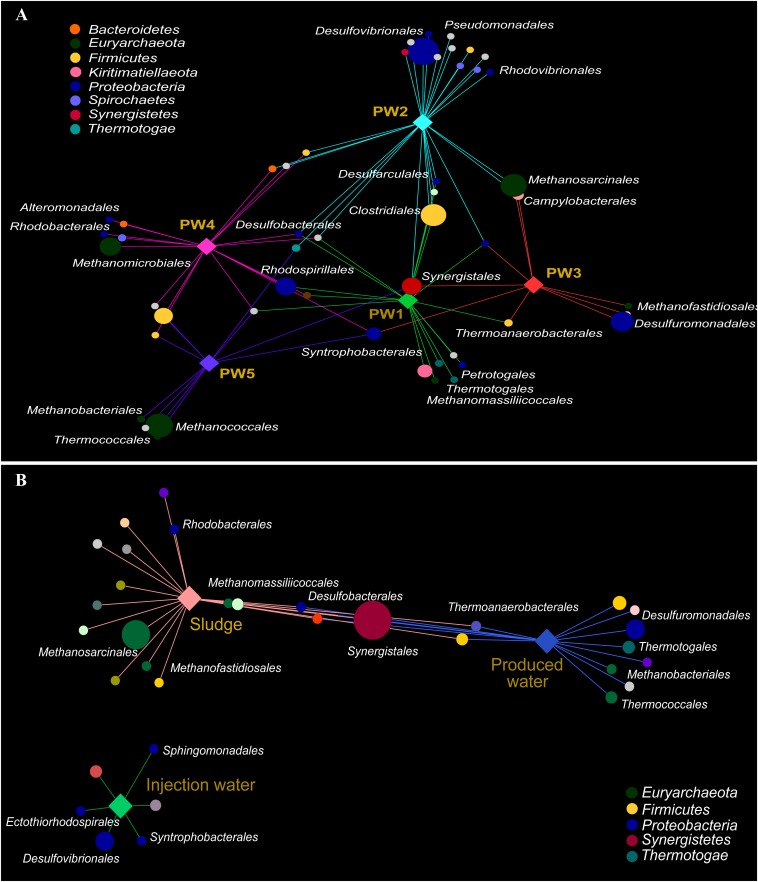
FIGURE 5.
Correlation-based association network between microbial community (order level) and sampling location. (A) Association network of active community with produced water stations. (B) Association network of total community with sample sources. Only statistical significant microbial orders are visualized (p ≤ 0.05). The size of each node is proportional to the taxon relative abundance and the edge width corresponds to the association strength of each taxon with the sampling location. Color of nodes contributes to prominent microbial phyla. Hub nodes and edges are colored according to sampling location.

