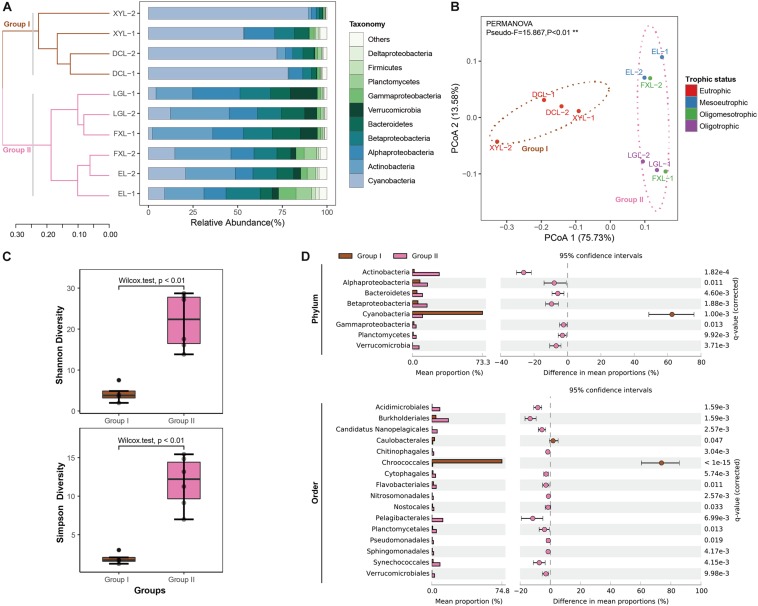
FIGURE 1.
Taxonomic structure and diversity of planktonic microbial communities in lakes exhibiting different trophic status. (A) The taxonomic structure across samples. The relative abundance of reads grouped at the phylum-level is shown for each metagenome library. Phyla with relative abundance not in the top ten are shown as “Other.” Hierarchical clustering (UPGMA) based on Bray–Curtis dissimilarity matrices. See detailed information in Supplementary Table S4a. (B) PCoA based on complete taxonomic community profiles with 75% confidence ellipses (phylum-level taxonomic annotations). Significant clusters are indicated by dashed lines (PERMANOVA, 9999 permutations, P < 0.01). (C) Boxplots figure shows the range of different alpha diversity indices. The box represents the lower quartile, median, and upper quartile. See detailed information in Supplementary Table S3. (D) The extended error bar plot shows that phyla and orders significantly over−/−under-represented in Group I and Group II samples (see Supplementary Tables S5a,b). The difference in mean proportions and the corrected p-value of significance are also pointed out.

