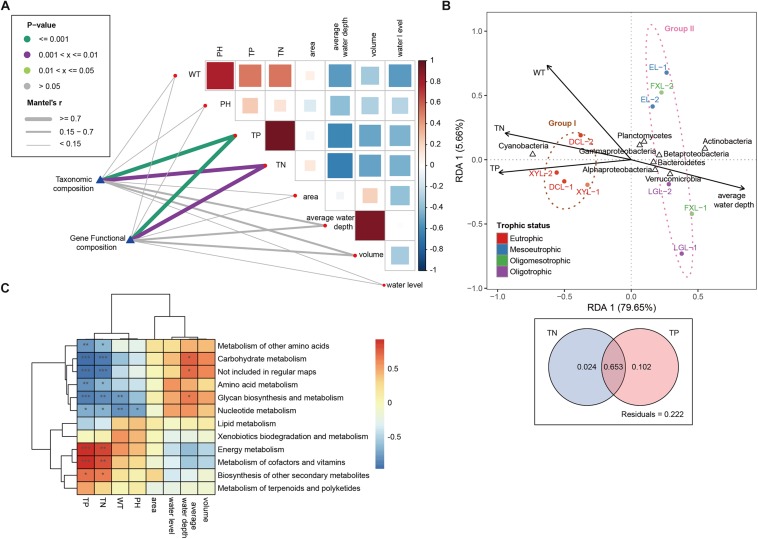
FIGURE 3.
Environmental drivers of community composition. (A) Pairwise comparisons of environmental factors are shown. The color gradients and box sizes represent Pearson’s correlation coefficient, and red indicates a positive correlation and blue indicates a negative correlation. Taxonomic and functional (based on metabolism KEGG modules) community composition are related to each environmental factor by Mantel tests. Line width corresponds to the Mantel’s r statistic for the corresponding distance correlations, and line color indicates the statistical significance based on 9999 permutations. (B) Redundancy analysis (RDA) is performed on the taxonomic profile (phylum level) and key environmental characteristics (WT, TN, TP, average water depth). Arrows indicate the correlation between environmental parameters and community structure. (C) Pearson’s correlations between all environmental factors and the relative abundances of the different metabolism categories (∗∗∗p < 0.001; ∗∗p < 0.01; ∗p < 0.05).

