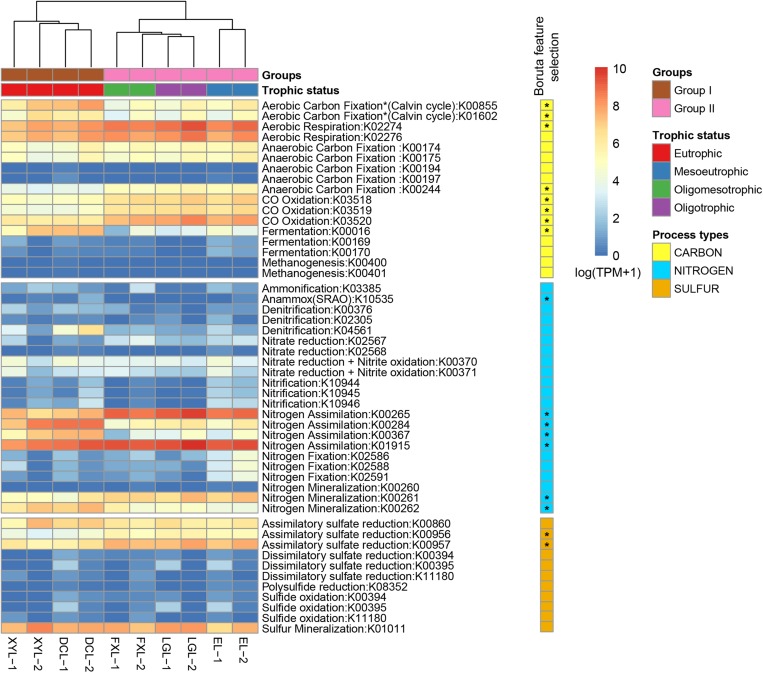
FIGURE 4.
Distribution of KOs involved in C, N, S cycle transformations in samples collected along the five Yun-Gui Plateau lakes. The heatmap displays the relative abundance [log2(TPM + 1)] of KOs across all samples. Hierarchical clustering (UPGMA) based on Bray–Curtis dissimilarity matrices. KOs that differentially segregated across groups are identified by random forest analysis with Boruta feature selection (1000 runs > 4).

