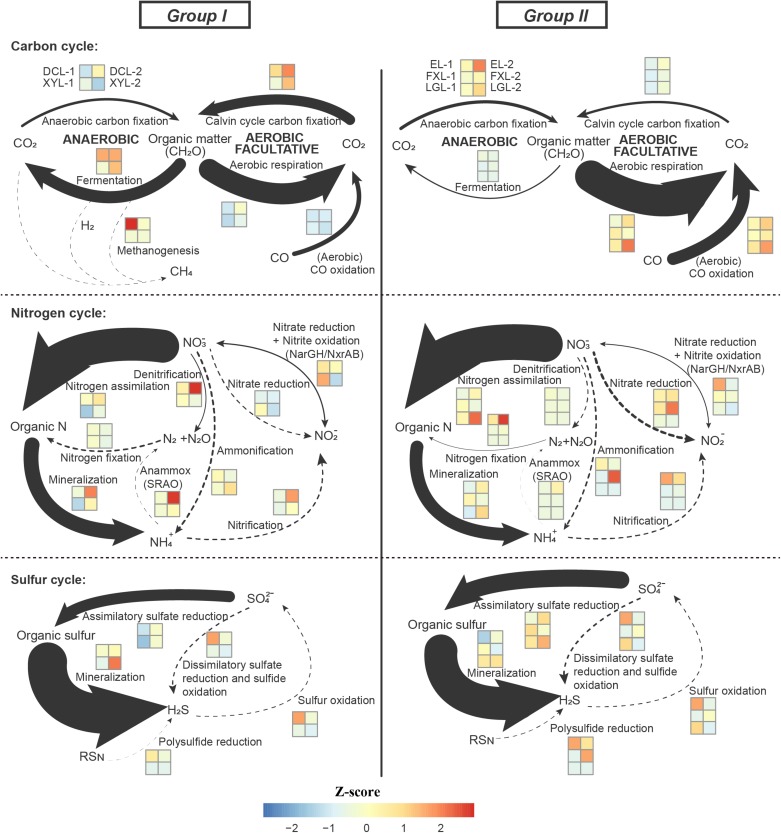
FIGURE 5.
Distribution of genes involved in the carbon, nitrogen and sulfur cycle. Genetic potential for several processes of the C, N, S cycle in the five Yun-Gui Plateau lakes using normalized marked genes. The genetic potentials for each conversion process are assessed based on the combination of these selected marker genes. For marker genes in the same process, the TPM values of genes with the same metabolic function are averaged, and the TPM values of genes with different metabolic functions are added. Arrow sizes are proportional to the genetic potential of the pathways (100% values of each cycle, see Supplementary Table S6). Dotted lines indicate that marked genes are rarely detected. Differences across trophic status are shown by z-score heatmap boxes indicated in each C/N/S transformation.

