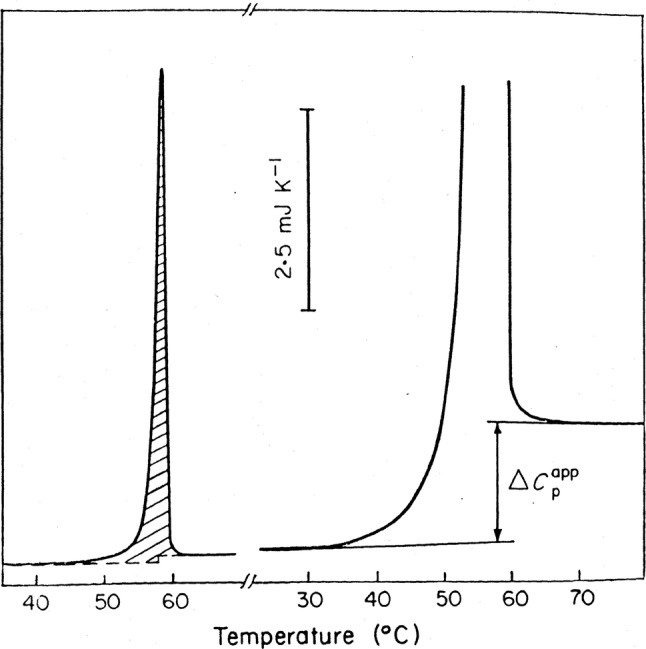
Fig. 2.

DSC recording of poly(A)∙poly(U) melting at 0.3 mM concentration (left) and a fragment of a recording at 5.0 mM concentration (right) The hatched area corresponds to the apparent melting enthalpy; arrows indicate the observed heat capacity change. The NaCl concentration is 0.1 M. (Filimonov and Privalov 1978). dΔH(A−U)/dT = 134 ± 10 J K−l mol−l
