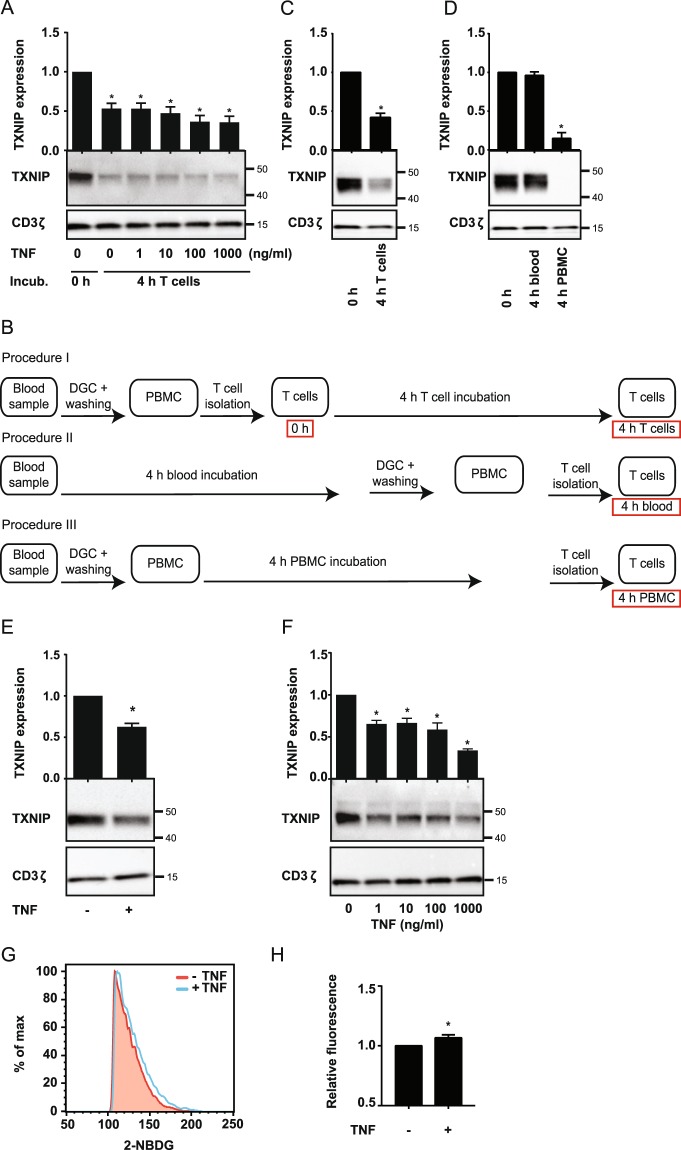
Figure 1.
TNF induces TXNIP down-regulation and increased glucose up-take in T cells. (A) Representative Western blot (lower panel) and quantification (upper panel) of TXNIP with CD3ζ as loading control from T cells lysed immediately after isolation (0 h, Procedure I, B) and after 4 hours of incubation (4 h T cells, Procedure I, B) with TNF (0–1000 ng/ml) as indicated. (B) Overview of the different T cell isolation and incubation procedures used. The text in the red frames gives the nomenclature for the T cell lysates analyzed and shown in the figures. (C) Representative Western blot (lower panel) and quantification (upper panel) of TXNIP with CD3ζ as loading control from T cells incubated for 0 hours (0 h, Procedure I, B) and 4 hours (4 h T cells, Procedure I, B) before lysis. (D) Representative Western blot (lower panel) and quantification (upper panel) of TXNIP with CD3ζ as loading control from T cells immediately isolated and lysed (0 h, Procedure I, B), isolated and lysed after incubation of blood samples for 4 hours (4 h blood, Procedure II, B), and isolated and lysed after incubation of PBMC for 4 hours (4 h PBMC, Procedure III, B). (E) Representative Western blot (lower panel) and quantification (upper panel) of TXNIP with CD3ζ as loading control from T cells isolated from blood samples incubated for 4 hours (4 h blood, Procedure II, B) in the absence (−) or presence (+) of TNF (10 ng/ml). (F) Representative Western blot (lower panel) and quantification (upper panel) of TXNIP with CD3ζ as loading control from T cells isolated from blood samples incubated for 4 hours (4 h blood, Procedure II, B) with the indicated concentrations of TNF. (F) Representative FACS histograms and (G) relative mean fluorescence intensity of 2-NBDG+ T cells isolated from blood samples that were incubated with 2-NBDG in the absence (−) or presence (+) of TNF (10 ng/ml) for 4 h (4 h blood, Procedure II, B) (mean + SEM, n = 3). (A–F) Each Western blot is representative for Western blots obtained from at least 3 different biological experiments and the quantification shows the mean + SEM of the band densities of TXNIP from Western blots obtained from at least 3 different biological experiments. The positions of the relevant molecular weight markers and their molecular weight in kDa are given to the right of each Western blot.

