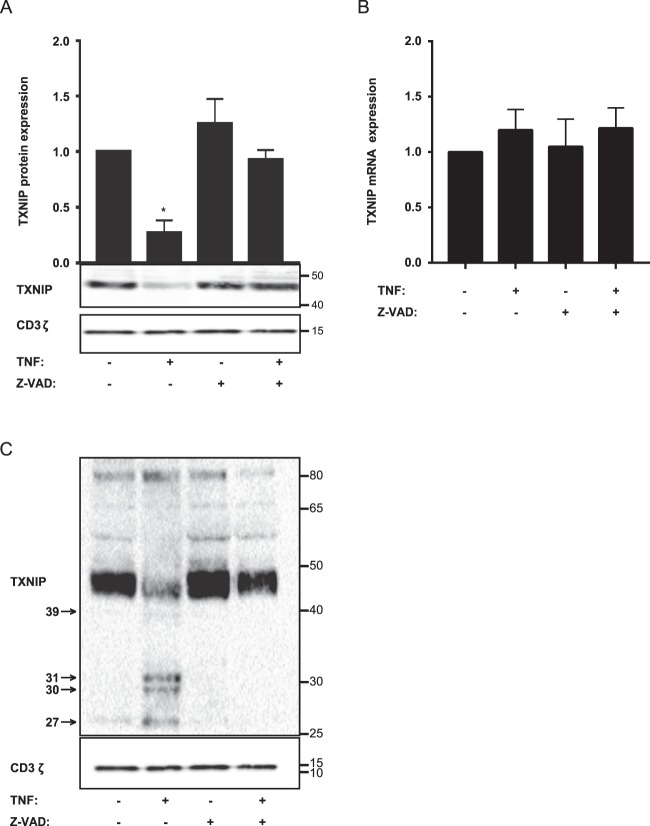
Figure 4.
TNF induces TXNIP down-regulation by a caspase-dependent mechanism. (A) Representative Western blot (lower panel) and quantification (upper panel) of TXNIP with CD3ζ as loading control from T cells isolated from untreated blood and blood treated with TNF (10 ng/ml) and the caspase inhibitor Z-VAD-FMK (Z-VAD) (10 µg/ml) for 4 hours (4 h blood, Procedure II, Fig. 1B) as indicated. The Western blot is representative for Western blots obtained from 3 different biological experiments and the quantification shows the mean + SEM of the band densities of TXNIP from Western blots obtained from 3 different biological experiments. (B) Relative TXNIP mRNA expression in T cells isolated from untreated blood and blood treated with TNF (10 ng/ml) and the caspase inhibitor Z-VAD-FMK (Z-VAD) (10 µg/ml) for 4 hours (4 h blood, Procedure II, Fig. 1B) as indicated (mean + SEM, n = 3). (C) Overexposed Western blot of TXNIP with CD3ζ as loading control from T cells isolated from untreated blood and blood treated with TNF (10 ng/ml) and Z-VAD-FMK (Z-VAD) (10 µg/ml) for 4 hours (4 h blood, Procedure II, Fig. 1B) as indicated. The arrows indicate putative TXNIP fragments from caspase-mediated cleavage of TXNIP and their molecular weight in kDa. (A,C) The positions of the relevant molecular weight markers and their molecular weight in kDa are given to the right of each Western blot.

