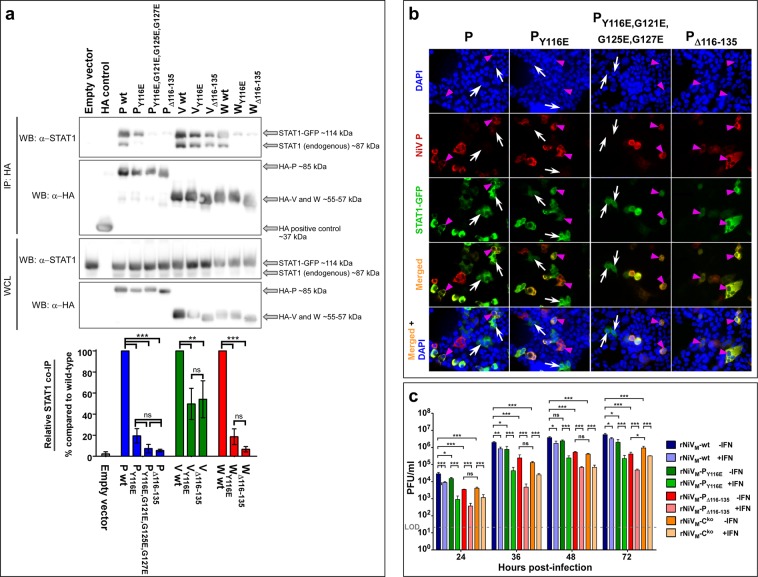
Figure 2.
In vitro characterization of STAT1-binding mutations. (a) 293 T cells were transfected with pCAGGS-STAT1-GFP along with pCAGGS-HA NiV-P, -V, and -W wild-type and mutant proteins were then assessed at 24 hours post-transfection by Western blot, representative blots from three independent experiments are shown. Relative binding of P, V, and W mutants with STAT1 was assessed using co-immunoprecipitation. Amount of binding in the IP fraction was normalized to total STAT1 for the same well, then expressed as a ratio to the wild-type protein for each mutant as shown in the graph. Each cropped portion of Western blot is outlined in black to indicate separate blots stained with different antibodies as indicated (full Western blots of each is found in Supplementary Fig. 2). Differences between samples were assessed using one-way analysis of variance followed by Tukey’s post hoc test. **p-value < 0.01; ***p-value < 0.001; ns, not significant. N = 3; error bars represent standard error of the mean. IP: immunoprecipitation, WCL, whole cell lysate. (b) Transfected cells were treated with universal IFN-α then fixed. Cell nuclei are stained with DAPI (blue); cells transfected with HA-tagged NiV P protein (red) show P protein in the cytoplasm but not the nucleus; cells transfected with fused STAT1-GFP show STAT1 in both the cytoplasm and the nucleus when P protein is not co-transfected (white arrows). Cells transfected with STAT1-GFP show no STAT1 present in the nuclei when co-transfected with wild-type NiV P (magenta arrowhead; first column panels) but STAT1 is present when co-transfected with NiV P protein containing the PY116E mutation (magenta arrowhead; second column panels), PY116E,G121E,G125E,G127E mutations (magenta arrowhead; third column panels), or PΔ116-135 deletion (magenta arrowhead; fourth column panels) indicating the ability of these mutations to ablate the ability of NiV P to sequester STAT1. Images taken: 20×. (c) Growth kinetics in Vero cells either without pre-treatment of IFN-α (dark colors) or with pre-treatment of IFN-α (light colors). Error bars show standard deviation. LOD: Limit of detection of 25 PFU/ml. Analysis of variance (ANOVA) with Dunnett’s multiple comparison test; N = 4: *p-value < 0.05; **p-value < 0.01; ***p-value < 0.001.

