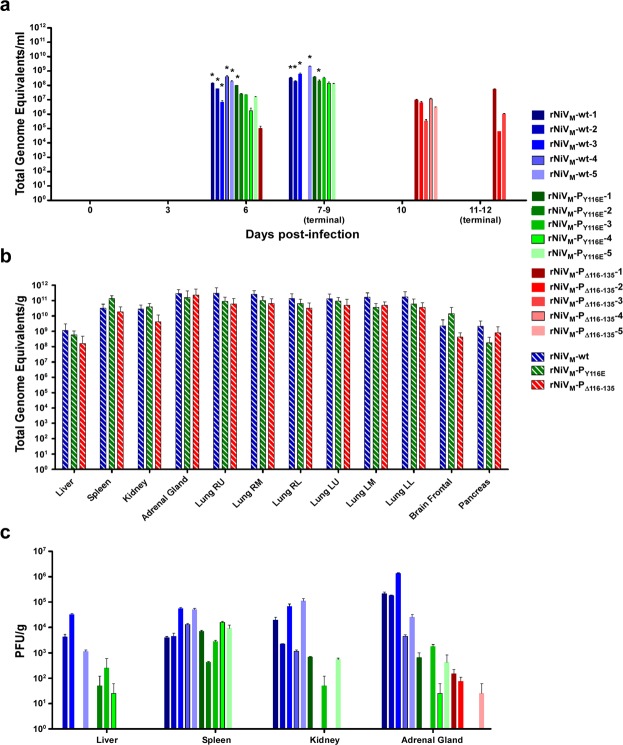
Figure 7.
Viral load in rNiVM infected ferrets. Viral load in ferrets as detected by genome equivalents (GEq) by qRT-PCR from (a) blood as GEq/ml and from (b) tissues as GEq/g (c) PFU/g of rNiVM isolated from tissues of ferrets after necropsy. Hashed lines represent the average of all animals in the respective cohorts. Error bars show standard deviation. N = 5 for hashed lines; N = 2 for all other lines. Right upper (R.U.), right middle (R.M.), right lower (R.L.), left upper (L.U.), left middle (L.M.), left upper (L.U.). *Indicates samples where rNiVM was successfully isolated from whole blood samples.

