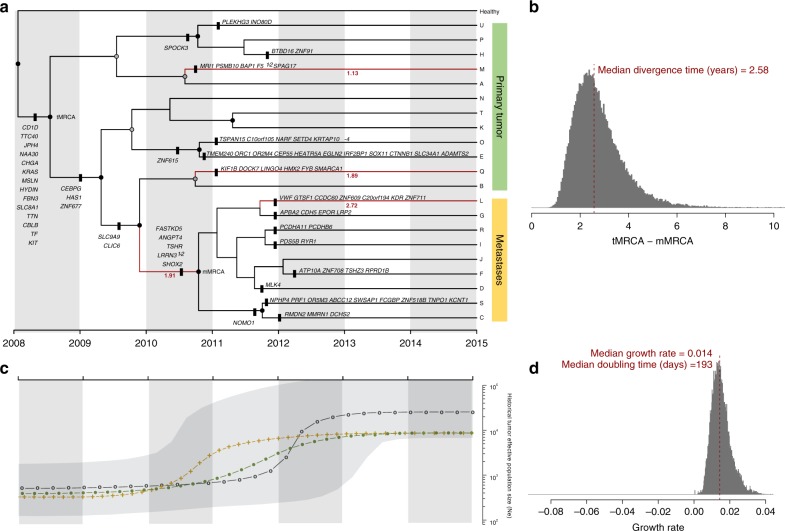
Fig. 2.
Phylogenetic and demographic reconstruction over time. a Maximum clade credibility (MCC) tree resulting from the BEAST analyses using the CloneFinder-derived clones. Tree nodes with posterior probability values >0.99 and >0.50 are indicated with black and gray solid circles, respectively. Clone IDs (A–U) are shown at the tips of the tree. The x-axis is scaled to years (assuming one generation every 4 days; see Methods). Only non-synonymous mutations are shown. Tree branches showing a dN/dS ratio >1 are highlighted in red together with the corresponding dN/dS value. b Posterior probability distribution of the relative divergence time in years of mMRCA in relation to the tMRCA (tMRCA minus mMRCA). The dashed red line depicts the median age estimate of the mMRCA. c Bayesian Skyline Plot analysis. The y-axis is in log scale. The black dotted line represents the historical effective population size of the entire cancer cell population (Ne). The gray shading illustrates the 95% HPD interval. Green and golden dotted lines correspond to the effective population sizes of the primary and metastatic populations, respectively. d Histogram illustrating the growth rate per generation of the tumor. The population doubling time is shown in days

