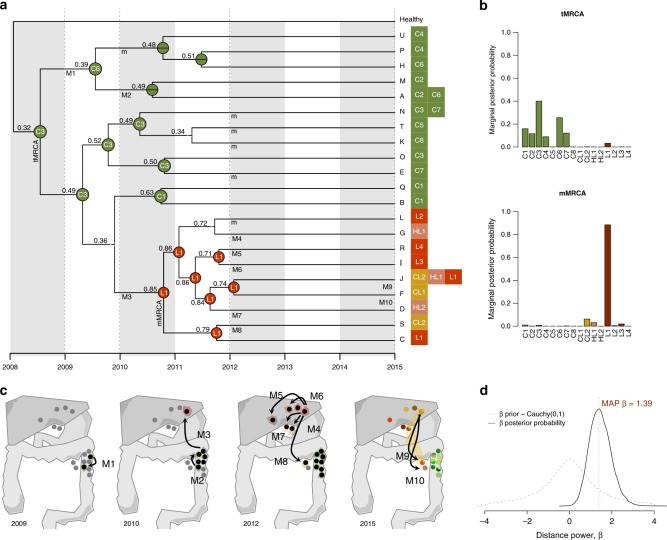
Fig. 3.
Inferred biogeographic history. a Biogeographic reconstruction from BayArea, describing the geographical range (i.e., the set of occupied locations) of the ancestral clones. At each tree node, the range with the highest posterior probability is depicted. The sample ID is shown for those ancestral nodes whose inferred area ranges are restricted to a single location. The locations where the extant clones (A–U) were sampled are shown next to the tips. Migration events are depicted in the panel below represented by an uppercase “M” and numbered (M1–M10). A lowercase “m” indicates the remaining migrations inferred. b Marginal posterior probabilities for the occupancy at single locations for the tumoral (tMRCA) and metastatic (mMRCA) ancestral clones. c Schematic representation of the clonal dynamics in anatomical space over four time points. From 2009 to 2012, samples where BayArea inferred the presence of tumor clones are highlighted in black. Colored areas surrounding samples anatomical location represent the inferred spatial distribution of the clonal populations. Arrows highlight the inferred migration events. d Comparison of the distance-dependent/independent dispersal models. The dashed gray line corresponds to the prior distribution for the distance power parameter, β~Cauchy(0,1). The solid black line indicates the posterior distribution obtained. The vertical dashed red line indicates the maximum a posteriori estimate of β

