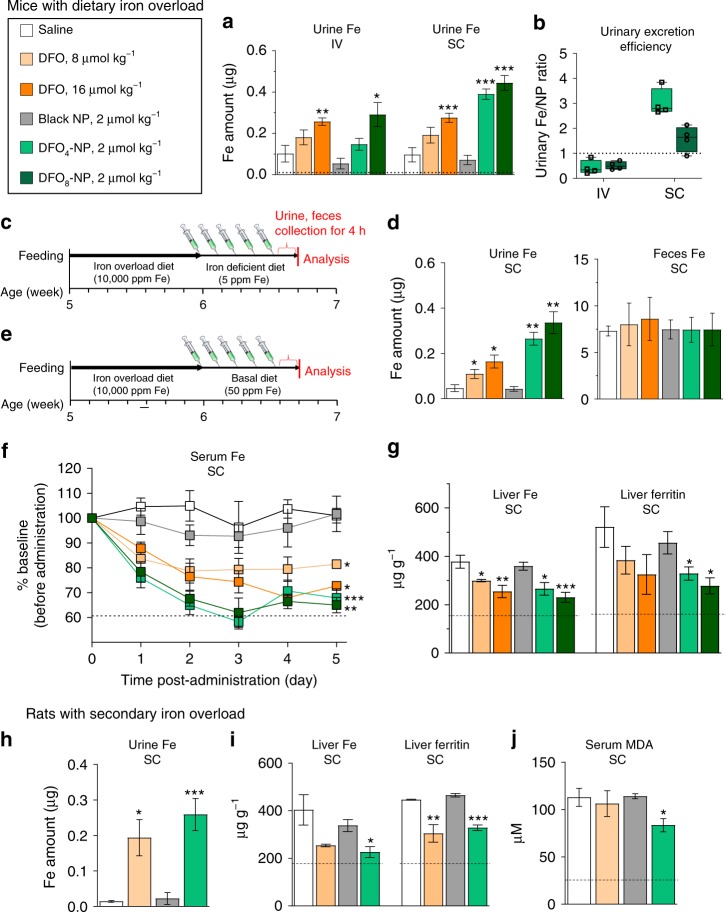
Fig. 3.
Iron levels in iron overload mice and rats treated daily with DFO-NPs: a, b Urinary iron excretion and efficiency of DFO-NPs treatment via IV and SC injection compared to saline and DFO treatments at 4 h post-injection. Dotted line in a indicates physiological reference levels from CD-1 mice fed basal diet (50 ppm Fe per kg). Dotted line in b indicates reference levels for Fe/DFO (centerline, median; whiskers, minimum and maximum). c Timeline for an iron-overload mouse model and DFO-NPs treatments for urine and fecal analysis. d The amount of iron excreted in urine and feces at 4 h post-injection after chelator treatment shown in c. e Timeline for an iron overload mouse model and DFO-NPs treatments for serum, liver, and spleen analyses. f Serum iron level and g iron and ferritin amount in liver of iron-overload mice treated with saline, DFO, and DFO-NPs via SC injection for 5 days. Dotted lines indicate physiological reference levels from CD-1 mice-fed basal diet (50 ppm Fe per kg). h Urine iron level, i ferritin level in liver, and j serum MDA level of iron overload Belgrade rats (b/b) treated with saline, DFO, and DFO-NPs via SC injection for 5 days. Dotted lines indicate physiological reference levels from +/b rats which display normal iron status. n = 3–8 per group, mean ± SEM. Student t-test was employed to compare the results between two groups. A one-way ANOVA followed by Tukey’s multiple comparisons test was used to assess the statistical differences among more than two groups. p values <0.05 were considered significant: *p < 0.05, **p < 0.01, and ***p < 0.001

