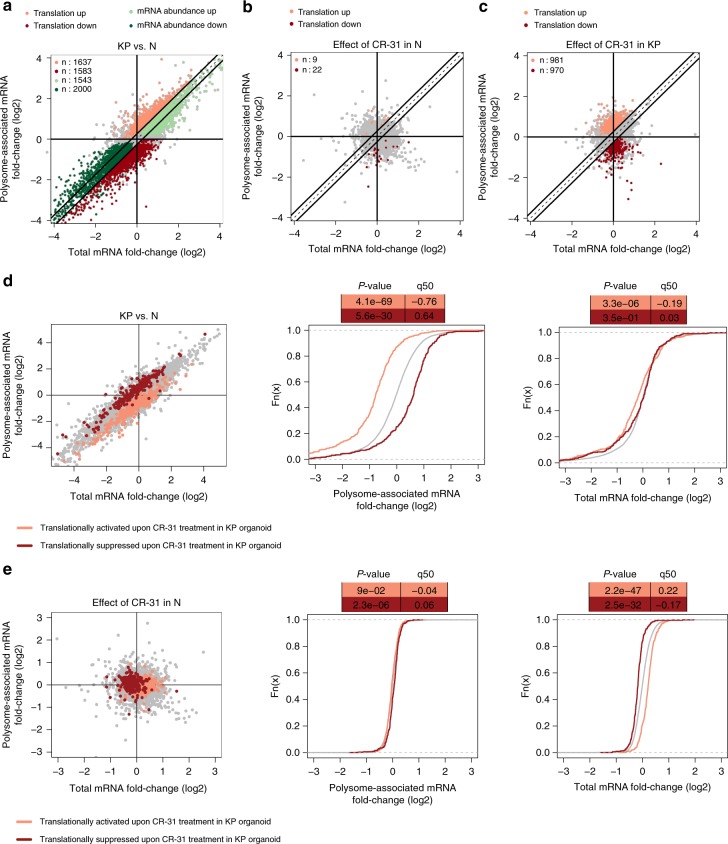
Fig. 2.
Tumour-selective modulation of translational efficiencies by CR-31. a Scatterplot of polysome-associated mRNA to total mRNA log2 fold-changes comparing vehicle-treated KrasG12D;p53R172H (KP) to normal (N) organoids. The numbers of mRNAs with a change in translation efficiency (light red and dark red) or mRNA abundance (light green and dark green) are indicated (n = 3; positive log2 fold-change indicates higher translation/abundance in KP organoids). b Scatterplot of polysome-associated mRNA to total mRNA log2 fold-changes comparing N organoids treated with vehicle or 10 nM CR-31 for 1 h. The numbers of mRNAs with a change in translation efficiency (light red and dark red) are indicated (negative log2 fold-change indicates suppressed translation upon CR-31 treatment). c Scatterplot of polysome-associated mRNA to total mRNA log2 fold-changes comparing KP organoids treated with vehicle or 10 nM CR-31 for 1 h. The numbers of mRNAs with a change in translation efficiency (light red and dark red) are indicated (negative log2 fold-changes indicates suppressed translation upon CR-31 treatment). d Scatterplot of log2 fold-changes for polysome-associated mRNA and total mRNA (left), an empirical cumulative distribution (ecdf) of log2 fold-changes for polysome-associated mRNA (middle) and total mRNA (right) comparing KP and N organoids. Transcripts whose translation was activated (light red) or suppressed (dark red) upon CR-31 treatment in KP organoids (i.e. from (c)) are indicated for each plot. Wilcoxon rank-sum test p-values comparing regulation of subsets to background are indicated together with the log2 fold-changes difference between these subsets to the background at the 50th percentile (q50) of the ecdf. e Same representation as in panel d but examining differences in gene expression in N organoids upon CR-31 treatment. Source data are provided as a Source Data file

