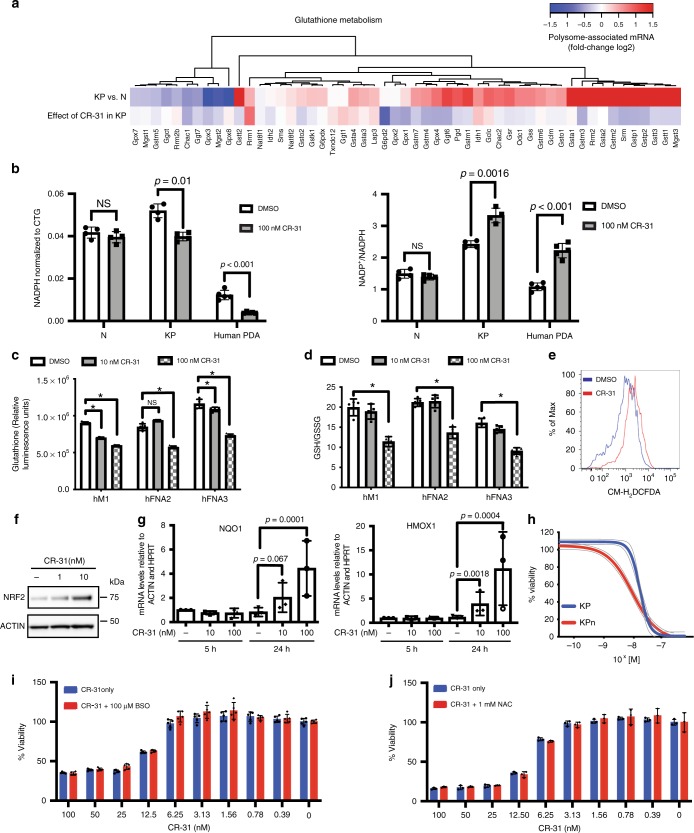
Fig. 3.
CR-31 translationally targets glutathione metabolism in PDA. a Heatmap of glutathione metabolism pathway proteins (KEGG database) showing fold-changes of polysome-associated mRNA. b Relative levels of NADPH normalized to viability based on CellTitre-Glo (CTG) assay (left) and ratio of NADP+ to NADPH (right) in organoids and patient-derived PDA lines upon treatment with vehicle (DMSO) or 100 nM CR-31 for 16 h. Data are mean +/–S.D. Student’s t-test, n = 4 (organoids), n = 5 (patient-derived lines). NS = not significant. c Relative levels of glutathione in patient-derived PDA lines upon treatment with vehicle or CR-31 for 24 h. Data are mean +/–S.D., Student’s t-test. n = 5, NS = not significant. *p < 0.05 compared to DMSO treatment. d Ratio of GSH to GSSG in patient-derived PDA lines upon treatment with vehicle or the indicated concentrations of CR-31 for 24 h. Data are mean +/–S.D., Student’s t-test, n = 5. *p < 0.05 compared to DMSO treatment. e ROS levels in KP organoids upon treatment with vehicle or 10 nM CR-31 for 16 h. Data are representative from three biological replicates. f NRF2 protein levels in KP organoids treated with CR-31 for 16 h. Actin, loading control. Representative image from 3 biological replicates. g mRNA expression of NRF2 target genes in 3 patient-derived PDA lines upon treatment with CR-31 for 5 or 24 h. Data are mean +/–S.D. Each data point plotted is average from every biological replicate. h Cell viability of KP and Nrf2-deficient KP (KPn) organoids upon a 72 h treatment with increasing concentrations of CR-31. Dotted lines indicate 95% confidence intervals, n = 5. i Cell viability of patient-derived PDA lines upon treatment with increasing concentrations of CR-31 in the presence or absence of 100 μM buthionine sulfoximine (BSO) for 72 h. Data are mean +/–S.D., n = 5. j Cell viability of primary murine PDA lines upon treatment with increasing concentrations of CR-31 in the presence or absence of 1 mM of the ROS scavenger N-acetylcysteine (NAC) for 72 h. Data are mean +/–S.D., n = 3. Source data are provided as a Source Data file

