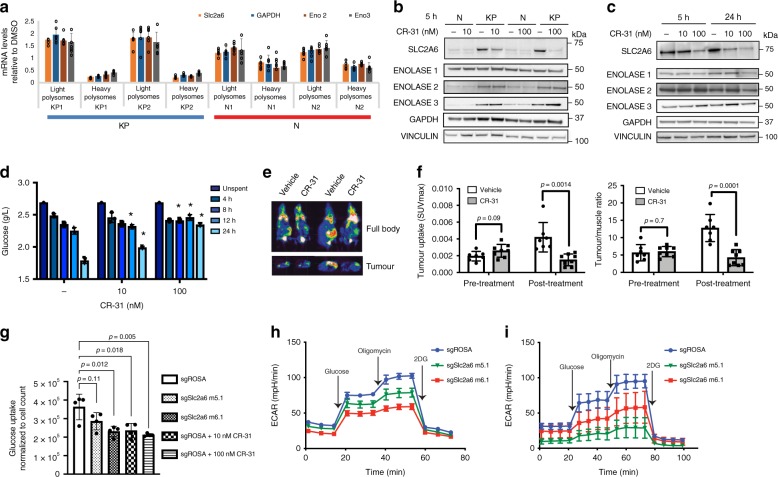
Fig. 5.
CR-31 translationally targets glucose uptake in PDA. a Levels of transcripts encoding glycolytic proteins in light (<3 ribosomes) or heavy (≥3 ribosomes) polysome fractions from N or KP organoids treated with 10 nM CR-31 for 1 h relative to vehicle. Data are mean +/− S.D. n = 6. b Immunoblot analysis of SLC2A6, ENOLASE 1, ENOLASE2, ENOLASE 3, and GAPDH in N and KP organoids upon vehicle or CR-31 treatment for 5 h. Vinculin, loading control. c Immunoblot analysis of SLC2A6, ENOLASE1, ENOLASE2, ENOLASE3, and GAPDH in patient-derived PDA lines upon vehicle or CR-31 treatment. VINCULIN, loading control. d Glucose concentration in media spent from KP organoids upon treatment with vehicle or CR-31. Data are mean +/− S.D., Student’s t-test, n = 3. *p < 0.05, compared to DMSO treatment at the same timepoint. e Representative 18F-FDG-PET images of pancreatic tumours from mice after 24 h of treatment with vehicle or CR-31. Top, coronal view; bottom, transverse view. f Tumour uptake plots comparing initial metabolic activity before and after treatment with vehicle or CR-31. Left, maximum standardized uptake value (SUV)max of tumour. Right, ratio of (SUV)max in tumour compared to muscles. Data are mean +/− S.D., Student’s t-test. n = 7, Vehicle; n = 8, CR-31. g Glucose uptake comparing Cas9-expressing murine PDA cell lines transduced with sgRNAs targeting the ROSA locus (sgROSA) or against different regions of the Slc2a6 gene (sgSlc2a6). Data are mean +/− S.D., normalized to cell numbers. Student’s t-test, n = 4. h ECAR was measured in equal numbers of Cas9-expressing primary murine PDA cell lines transduced with sgRNAs targeting the ROSA locus (sgROSA) or different regions of the Slc2a6 gene (sgSlc2a6). ECAR was measured following the addition of glucose, Oligomycin, and 2DG. Data are mean +/− S.D., n = 5. i ECAR was measured in equal numbers of Cas9-expressing KP organoids transduced with sgRNAs targeting the ROSA locus (sgROSA) or different regions of the Slc2a6 gene (sgSlc2a6). ECAR was measured following the addition of glucose, Oligomycin, and 2DG. Data are mean +/− S.D., n = 6. Source data are provided as a Source Data file

