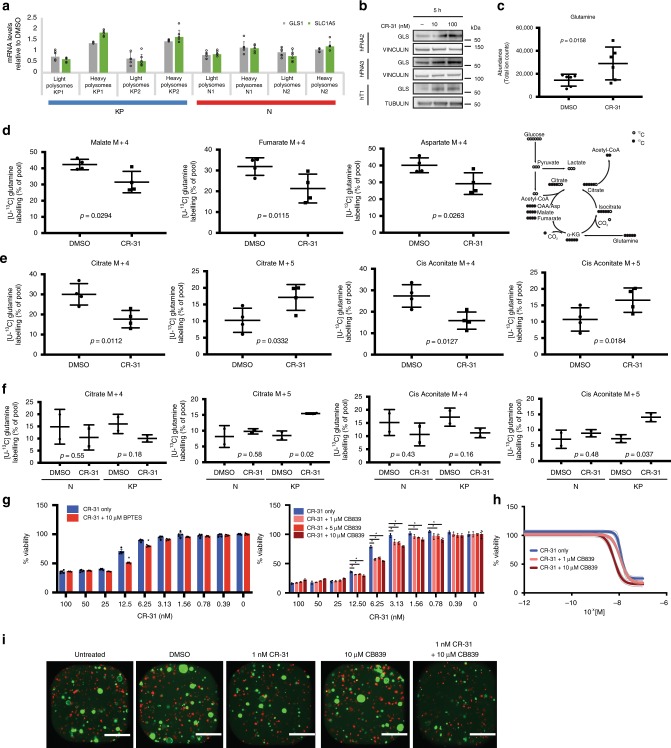
Fig. 6.
CR-31 treatment increases reverse glutamine metabolism in pancreatic cancer cells. a Levels of transcripts encoding proteins involved in glutamine metabolism in light (<3 ribosomes) or heavy (≥3 ribosomes) polysome fractions from N or KP organoids treated with 10 nM CR-31 for 1 h relative to vehicle (DMSO). Data are mean +/– S.D., n = 6. Data from two biological replicates are shown. b Immunoblot analysis of GLS in patient-derived PDA cell lines upon treatment with vehicle or CR-31 for 5 h. VINCULIN, TUBULIN, loading controls. c Intracellular levels of glutamine at steady state from 3 patient-derived PDA cell lines (2 technical replicates each) treated with vehicle or 100 nM CR-31 for 5 h. Data are mean +/– S.D., Student’s paired t-test. d 13C5-glutamine tracing of 4 patient-derived PDA cell lines upon treatment with vehicle or 100 nM CR-31 for 5 h. Data are mean +/– S.D., Student’s paired t-test. Right, schematic illustrating the flow of heavy carbons through glutamine metabolic pathways. e 13C5-glutamine tracing of 4 patient-derived PDA cell lines upon treatment with vehicle or 100 nM CR-31 for 5 h. M + 4 indicates metabolites of oxidative glutaminolysis and M + 5 indicates metabolites of reductive glutaminolysis. Data are mean +/– S.D., Student’s paired t-test. f 13C5-glutamine tracing of N (n = 2) and KP (n = 2) organoids upon treatment with vehicle or 100 nM CR-31 for 5 h. Data are mean +/– S.D., Student’s t-test. g Cell viability of patient-derived PDA lines upon a 72 h treatment with increasing concentrations of CR-31 and the indicated concentrations of the glutaminase inhibitor BPTES (n = 5) or CB839 (n = 3). Data are mean +/– S.D., Student’s t-test, *p < 0.05 compared to CR-31 only treatment. h Cell viability of KP organoids upon a 72 h treatment with increasing concentrations of CR-31 and the indicated concentrations of CB839. Dotted lines indicate 95% confidence intervals, n = 5. i KP organoids (GFP-labelled) in co-culture with pancreatic cancer-associated fibroblasts (mCherry-labelled) upon a 72 h treatment with CR-31 in the presence or absence of CB839. Representative images from two biological replicates. Scale bars, 1000 μm. Source data are provided as a Source Data file

