Fig. 1.
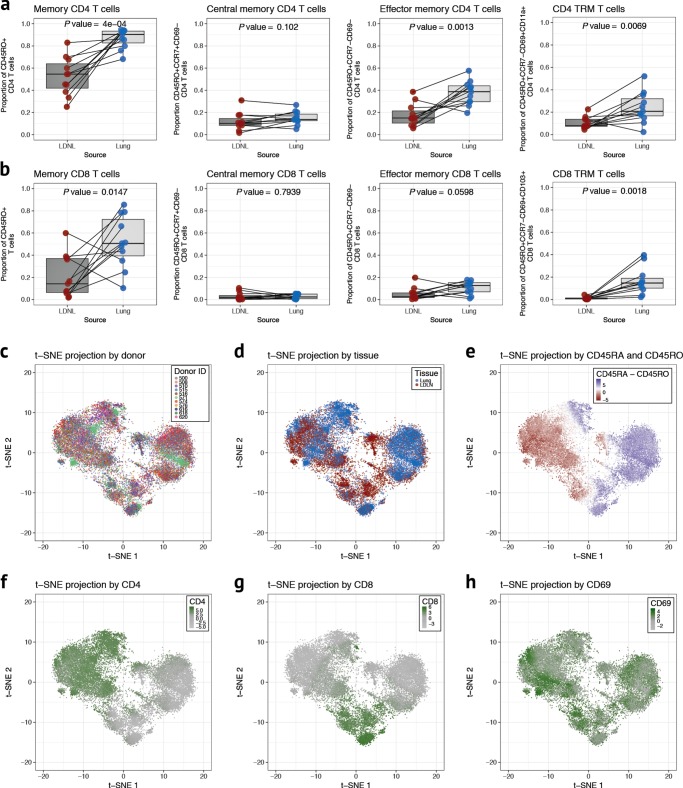
T cell phenotypes from human lung and LDLNs. a Cell proportions of CD4 memory, CM, EM and TRM T cells in paired lung (blue) and LDLN (red) samples (n = 11, paired samples from the same donor are connected by a black line) using a standard gating strategy. Proportions are relative to CD4 gated events. P values are from a paired t-test. Horizontal lines in the boxplot indicate median values and 25th and 75th percentile of values. b Cell proportions of CD8 T cell subsets as described in a. c t-SNE projection generated using cell phenotype data after random downsampling to 2500 cells for each sample with cells colored according to donor. d t-SNE projection with cells colored according to tissue site (lung in blue and LDLN in red). e Cells in t-SNE plot are colored according to the difference in the levels of CD45RA and CD45RO. t-SNE projections for levels of CD4 (f), CD8 (g) and CD69 (h)

