Fig. 8.
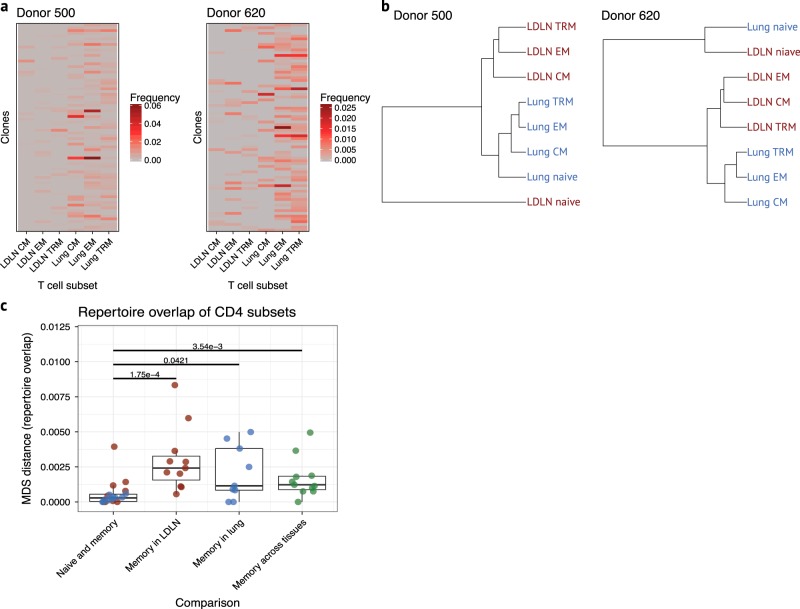
T cell receptor repertoires in lung and LDLN CD4 T cell subsets. a Heatmap of clonal overlap between memory CD4 T cell subsets for 2 donors. The 75 clones with the highest frequency of clonal overlap for each donor were included for this analysis. Heatmaps for other donors are shown in Supplementary Fig. 11. b Hierarchical clustering of CD4 subsets based on clones present in more than one subset. Clustering from two donors is shown and representative of clustering observed in other donors (shown in Supplementary Fig. 12). c Multidimentional scaling distance between CD4 T cell subsets for each individual is shown relative to subsets and tissue. First boxplot, distance between naive CD4 and the average of memory CD4 subsets was calculated separately for lung (blue) and LDLN (red) for each donor. Second boxplot, average of the distance between memory CD4 subsets in LDLN. Third boxplot, average of the distance between memory CD4 subsets in lung. Fourth boxplot, average of the distance between lung and LDLN memory of phenotypically identical CD4 memory subsets. Green indicates comparisons between tissues. Wilcoxon rank-sum test P values between groups are shown. Horizontal lines in the boxplot indicate median values and 25th and 75th percentile of values

