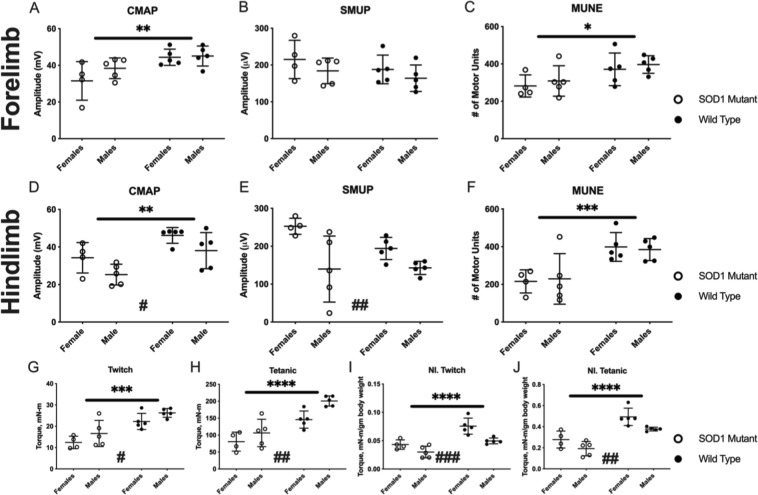
Figure 5.
Baseline forelimb (A–C) and hindlimb (D–F) electrophysiology assessment demonstrated loss of motor unit connectivity in mutant SOD1 rats, while hindlimb muscle contractility (G–J) was also reduced in mutant SOD1 rats. (A) Forelimb compound muscle action potential (CMAP) demonstrated significant differences in genotype (p = 0.006) but no differences for sex (p = 0.232) or significant interaction (p = 0.323). (B) Forelimb single motor unit potential (SMUP) demonstrated no differences for genotype (p = 0.222) or sex (p = 0.160). (C) Forelimb motor unit number estimation (MUNE) demonstrated significant differences for genotype (p = 0.017) but no differences for sex (p = 0.438) and no interaction (p = 0.986). (D) Hindlimb compound muscle action potential (CMAP) demonstrated significant differences for sex (p = 0.020) and genotype (p = 0.002) but no significant interaction (p = 0.985). (E) Hindlimb single motor unit potential (SMUP) demonstrated differences for sex (p = 0.003) but no differences for genotype (p = 0.241) and no interaction (p = 0.195). (F) Hindlimb motor unit number estimation (MUNE) demonstrated significant differences for genotype (p < 0.001) but no differences for sex (p = 0.991) and no interaction (p = 0.744). Electrophysiology data presented as mean ± standard deviation and comparisons performed using two-way ANOVA. Mutant SOD1 rats are presented as ○ and wild type control rats as ●. Asterisks indicate statistical differences in genotype: *p < 0.05, **p < 0.01, ***p < 0.001. Number signs indicate statistical differences in sex: #p < 0.05, ##p < 0.01. (G) Absolute triceps surae (hindlimb) twitch torque demonstrated significant differences for genotype (p < 0.001) and sex (p = 0.046) with no significant interaction (p = 0.962). (H) Absolute triceps surae tetanic torque demonstrated differences for genotype (p < 0.001) and sex (p = 0.008) with no significant interaction (p = 0.284). (I) Normalised twitch torque demonstrated significant differences for genotype (p < 0.001) and sex (p < 0.001) with no significant interaction (p = 0.188). (J) Normalised tetanic torque demonstrated significant differences for genotype (p < 0.001) and sex (p = 0.0048) with no significant interaction (p = 0.635). Hindlimb contractility data presented as mean ± standard deviation and comparisons performed using two-way ANOVA. Mutant SOD1 rats are presented as ○ and wild type control rats as ●. Significant differences for genotype, but not sex, were illustrated. Asterisks indicate differences in genotype: ***p < 0.001, ****p < 0.0001. Number signs indicate statistical differences in sex: #p < 0.05, ##p < 0.01, ###p < 0.001.

