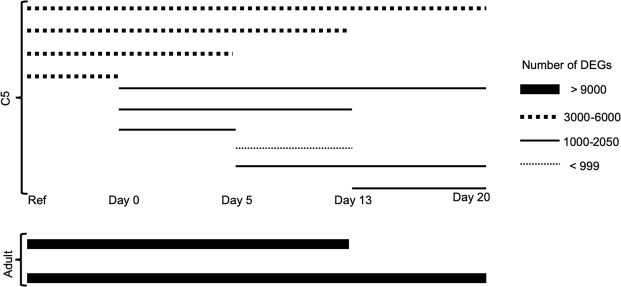
Figure 4.
Illustration of the number of differentially expressed genes (DEGs) between comparisons, analyzed by GLMs. All DEGs are listed in Supplementary Table S3. The start and end of each line indicates which comparison the line refers to. The thicker the line, the more DEGs between the compared groups, e.g. >9000 DEGs between the reference group and adults sampled on days 13 and 20. The thinner line, the fewer DEGs, e.g. <999 DEGs between experimental C5s sampled on days 5 and 13.

