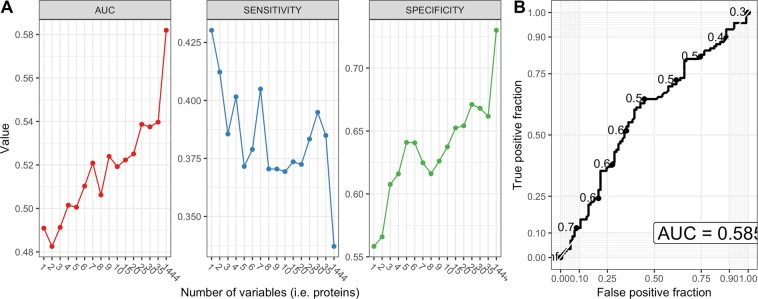
Figure 5.
Modelling results from the recursive feature elimination method. (A) Each dot that forms curves was chosen automatically by the random forest algorithm trained on the number of protein features specified by x-axis. The best performance was achieved by random forest that was trained on all 1444 protein concentrations or ratios of protein concentrations remaining after pre-processing which achieved AUC of 0.585 for all samples with a sensitivity of 34% and specificity of over 70%. (B) ROC curve based on the highest values of sensitivity, specificity and AUC. ROC, receiver operating characteristic; AUC, area under the curve.

